


Indian Stock market Detailed Technical Analysis with Chart Studies
Stock-Markets / India Apr 26, 2010 - 01:12 AM GMTBy: StocksBuddy

 Previous Week:
Last Week Nifty showed good strength as it held on it's own. When looking at stocks or indices everyone looks at the same chart but with different conclusions and perspectives. Everyone believes that the support/resistance levels would be different. But what eventually works out is anybody's guess.
As you can see from Daily chart of nifty below, Nifty nicely tagged the Lower Bollinger Band and found solid support there.
Previous Week:
Last Week Nifty showed good strength as it held on it's own. When looking at stocks or indices everyone looks at the same chart but with different conclusions and perspectives. Everyone believes that the support/resistance levels would be different. But what eventually works out is anybody's guess.
As you can see from Daily chart of nifty below, Nifty nicely tagged the Lower Bollinger Band and found solid support there.
Since touching the lower BB, nifty did NOT look back. In fact if someone bought at the lower BB, they are already up nearly 3% on just the index in less than 4 trading sessions.
Technically Speaking:
Take a look at the Daily Nifty chart below.
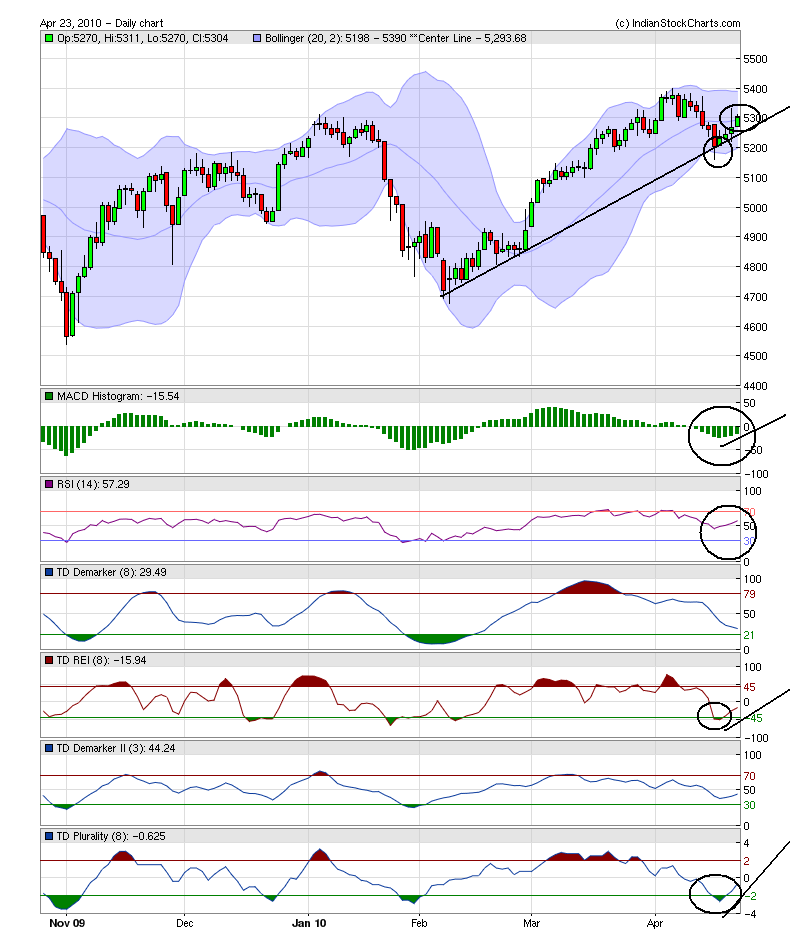
The above chart uses TD Demark indicators extensively.
Positives:
- Found Solid support at the Lower BB and never looked back
- MACD looks great and is moving up nicely.
- Almost all of the TD indicators are slowly circling back from ST (short term) oversold zones.
- The best of all, Nifty managed to close above center BB line.
- Unless nifty continues to move up this coming week, there is a potential of developing solid Negative Divergences on almost everything you see in the above chart. Price and Indicators alike.
- On the weekly charts, MACD histogram is still continuing it's downward slope and is looking to roll-over to the negative zone. Not good.
Next Week:
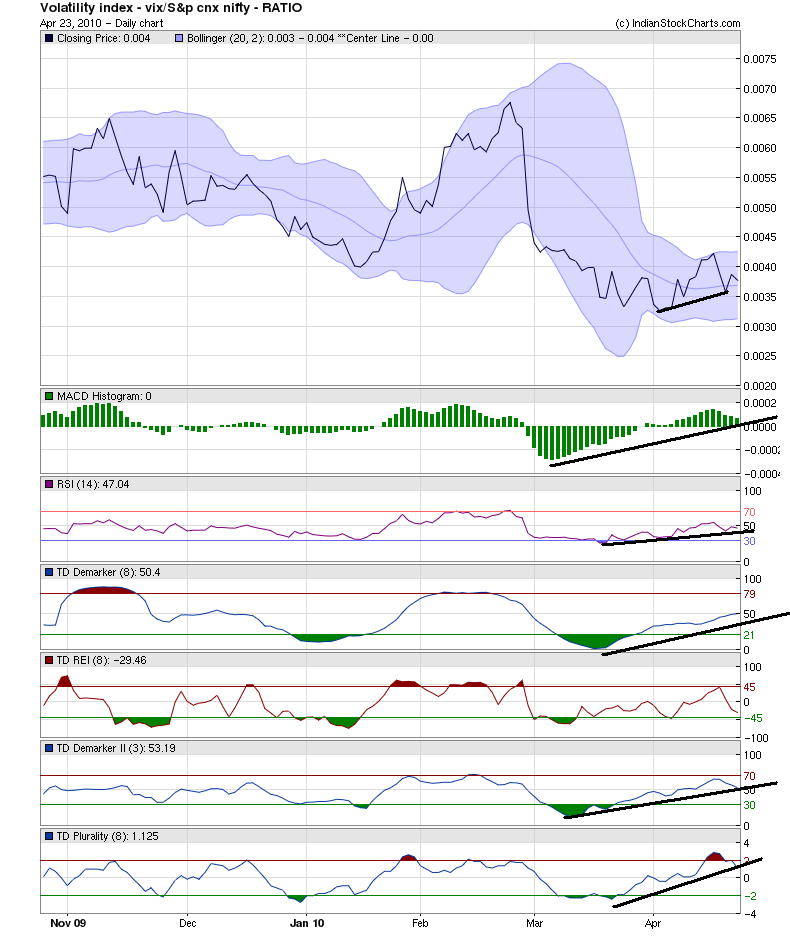
Nifty closed the previous week on a very strong note and owing to US markets solid close, Nifty is expected to at least open gap up on monday. What happens after that will mostly depend on how things shape up in Indian and Global markets. Unless there is a catalyst, things will probably continue to move up as they were all of the last 3 odd months sitting in the MOST overbought zone that world stock markets has witnessed in decades. The chart below is the ratio chart of Indian VIX (Volatility index) to Nifty. This chart shows the correlation between Volatility and the moves in Nifty.
The lower this chart, the higher the chances for Nifty to move up and vice-versa. This chart tells another story or rather supporting to what we just stated above in our positives. It is clearly showing positive divergence on price and indicators alike. When a stock breakouts OUT of it's trading range, it is always healthy for it to pullback to it's previous breakout levels. The same could be said of this chart too. There is literally nothing negative on this chart, at least not at this time, which would mean nifty has high chance of correction next week and subsequent weeks.
Next week could be a volatile one in the Indian equity markets owing to what is said above AND being the options expiration week. Maximum OI is at 5200. If you have already initiated a short position, trade with strict SL. Not really a good idea to go long in the coming week since there is a chance of negative divergence developing up. It is better to wait until the dust settles down and nifty clearly tells us which way it is going to go. Yes, you may loose a few points early on, but there will be lot more that you can catch with more confidence.
Have a Wonderful Trading Week ahead.
Regards
Disclaimer: At the time of this writing, neither the authors nor our team held any positions on any securities unless otherwise explicitly stated. All information above is only for educational purposes and you are responsible for your own actions.
India's No.1 Trading Community From the desk of StocksBuddy.com Analysts comes the above article. SB Analyst team comprises of experts from varied fields such as Technical Analysis, Fundamental Analysis, Macro-Micro Economics, World Affairs, Currency and much more. Apart from user contributions, our analysts post analysis on StocksBuddy.com on a regular basis. For more details, please visit us @ http://www.stocksbuddy.com/blogs
© 2009 Copyright StocksBuddy - All Rights Reserved
Disclaimer: The above is a matter of opinion provided for general information purposes only and is not intended as investment advice. Information and analysis above are derived from sources and utilising methods believed to be reliable, but we cannot accept responsibility for any losses you may incur as a result of this analysis. Individuals should consult with their personal financial advisors.
© 2005-2022 http://www.MarketOracle.co.uk - The Market Oracle is a FREE Daily Financial Markets Analysis & Forecasting online publication.