


Indian Stock Market Weekly Analysis and Outlook
Stock-Markets / India Apr 17, 2010 - 07:43 AM GMTBy: StocksBuddy

 Detailed Technical Analysis with Chart studies from IndianStockCharts.com
Previous Week:
Last Week Nifty failed to make a new high and followed to the downside as was stated in our last week's analysis. We clearly stated that if the ratio of Indian Vix to Nifty touches/crosses above 0.004, then be rest assured that the correction has begun. And so it did. Almost all of last week Nifty was in correction mode with no real buying strength witnessed across the board.
Technically Speaking:
Take a look at the Daily Nifty chart below.
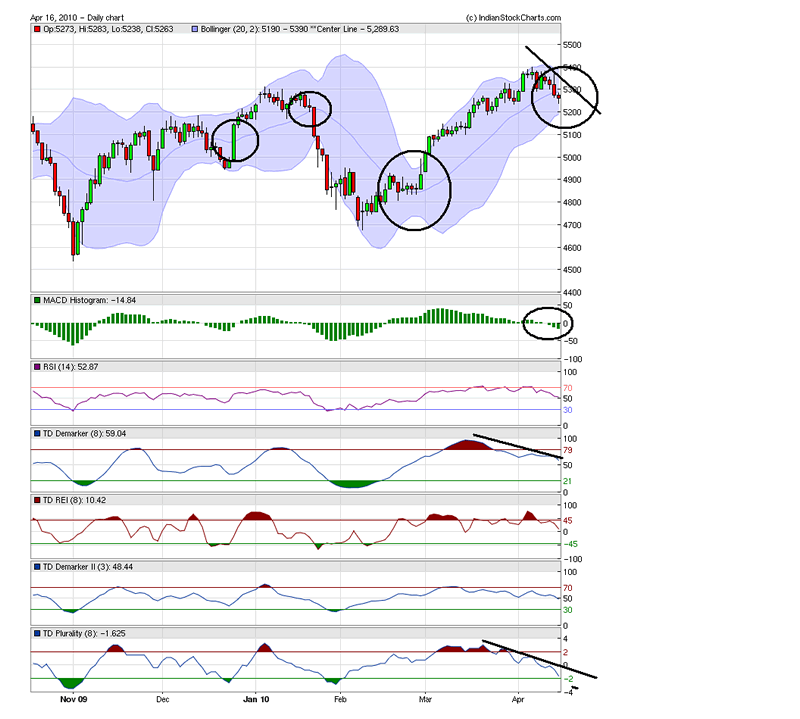
The above chart uses TD Demark indicators extensively.
Positives:
- None.
- As stated in our previous analysis, the negative divergences that were flashing all over the place for weeks, finally showed up this week with price following such divergences on indicators
- As you can see, all of the indicators above are glaring red right now. There is literally Nothing positive that can be shown here. One trick here is the Bollinger bands. If a stock/index stays decisively ABOVE the center line of a BB channel, then it is in a strong uptrend. Likewise, if it goes below this center BB line and cannot move back up, it is deemed to have entered into a correction phase/downtrend. As you can see from the above chart, we have circled ALL those areas where nifty crossed this center BB line and started a NEW trend, either bull or bear. Timing is everything in this market. And you need to have solid indicators that can support your analysis.
Next Week:
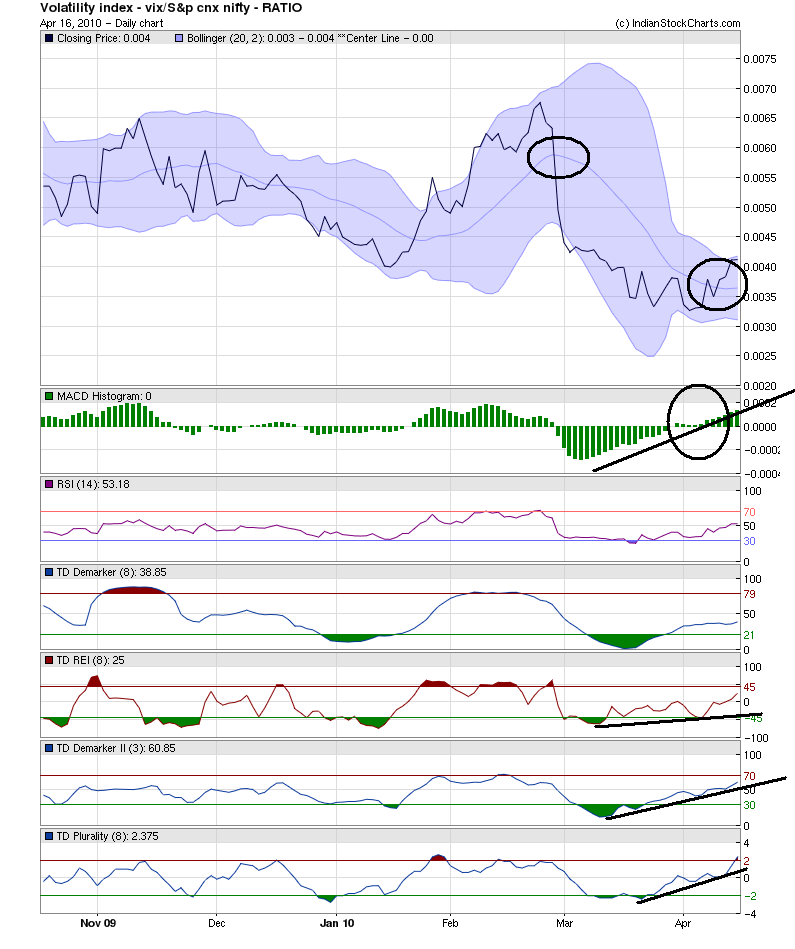
Actions from this week have clearly been bearish. With World indices also responding nicely to the downside, it is anybody's guess that this coming week will be flat-to-negative with mostly negative bias. The chart below is the ratio chart of Indian VIX (Volatility index) to Nifty.
This chart shows the correlation between Volatility and the moves in Nifty. The lower this chart, the higher the chances for Nifty to move up and vice-versa. This chart identified the start of correction much before the actual action began, last week itself. This ratio chart has clearly broken the downtrend. All the indicators on this chart too are either nicely moving up or have clear positive divergence.
Next week will give clear indication of which way things are going to move. Even though we have more than enough confirmations that the downtrend has begun, it is still better to get a day or two of confirmed move down. Monday will be a down day for sure, after the huge down day in the US equity markets. What happens on tuesday holds the cue.
In any case, it is safe to open up Short positions and close any long positions you may be sitting on.
Have a Wonderful Trading Week ahead.
Regards
India's No.1 Trading Community From the desk of StocksBuddy.com Analysts comes the above article. SB Analyst team comprises of experts from varied fields such as Technical Analysis, Fundamental Analysis, Macro-Micro Economics, World Affairs, Currency and much more. Apart from user contributions, our analysts post analysis on StocksBuddy.com on a regular basis. For more details, please visit us @ http://www.stocksbuddy.com/blogs
© 2009 Copyright StocksBuddy - All Rights ReservedDisclaimer: The above is a matter of opinion provided for general information purposes only and is not intended as investment advice. Information and analysis above are derived from sources and utilising methods believed to be reliable, but we cannot accept responsibility for any losses you may incur as a result of this analysis. Individuals should consult with their personal financial advisors.
© 2005-2022 http://www.MarketOracle.co.uk - The Market Oracle is a FREE Daily Financial Markets Analysis & Forecasting online publication.