S&P 500 Stocks Uptrend With Expanding Voume
Stock-Markets / Stock Markets 2010 Apr 15, 2010 - 04:25 AM GMTBy: Piazzi
 Volume expands for two days in a row!
Uber bears have had two main arguments against the advance. They have constantly been harping on on sentiment being bullish and volume being absent.
Readers of this blog know that I regards survey type sentiments as some kind of background, secondary piece of information at best, and outright he-said-she-said confusing piece of noise at worst – definitely not a trade trigger
As for volume, time and time again, I have said that with something like a composite or an index, price can very often lead. In fact, you wouldn’t want heavy volume participation in the early stages of a rally, you’d ideally want quiet, yet steady runs on good breadth, and, later on, you’d want the masses to join and bid you up. Regardless, volume is not a trading trigger.
These past two days, we have had the return of volume. It might be due to this being an OpEx week, or not, but the fact is that more participation is afforded to the rally, so, now that market has taken care of most of the bears, and more money is flowing into the market, maybe we are finally approaching the end to this rally.
This is a weekly chart of S&P
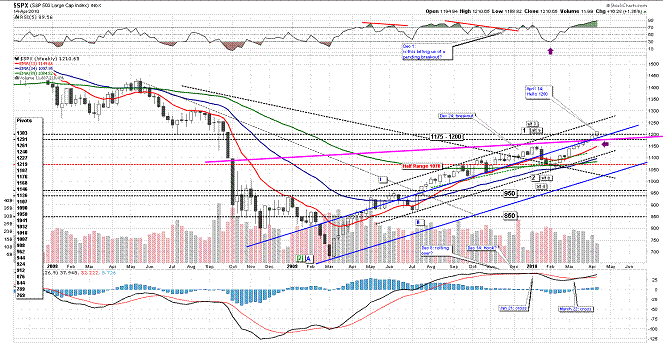
Index pushed through the widely touted 1200 level today. Other than being overbought, there is nothing technically negative about the chart above.
Lots of positives: lots of support, beautifully aligned MAs, an active MACD buy signal, nice move along the channel, the works.
This is a daily chart
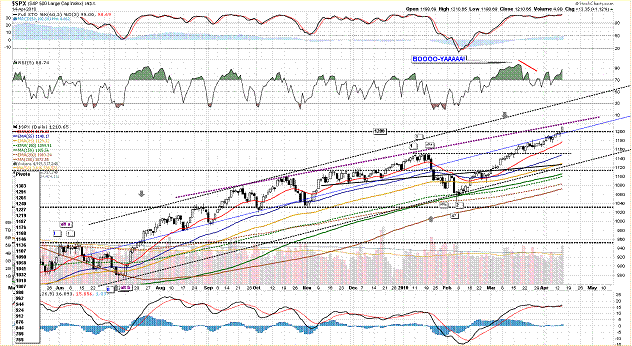
Just look at RSI!!
That is a monstrous hell of a lot of momentum going into every small degree wave – waves that we can’t even see clearly on a daily chart.
I have drawn an actionary purple line that might become resistance for this run. I am not predicting anything. It’s just an interesting line and I’ll be watching how index behaves if it gets there. Currently, it coincides with our 1222 OEW pivot.
There is a lot of support below. 1200 area is obvious. And there are the blue center line of the channel, and the MAs. It should be easy to pick points for stops
As I have said before, bears lost their last chance when they miserably failed at breaking the market in February. That made the advance since March 2009 a 5-wave affair and, as such, either part of a bull run, or 5-wave part of a yet-to-be completed 7-wave, or 11-wave bear rally. Either way, market told the bears to just pipe down and take a hike for a while
This is what I wrote on February 19, and repeated on March 14
“The move from Feb Lows looks very similar to the one from July lows. While future will tell us how similar they will in fact be. I shall remember that the July move destroyed the bears, and also kept a lot of bulls out waiting for a retest or pullback or whatever.”
Look at the run since Feb low! So far, it’s been even more relentless that the run of July. Harsh on the bears, and no palpable pullback for the bulls.
Daily volume expanded nicely and breadth was very good
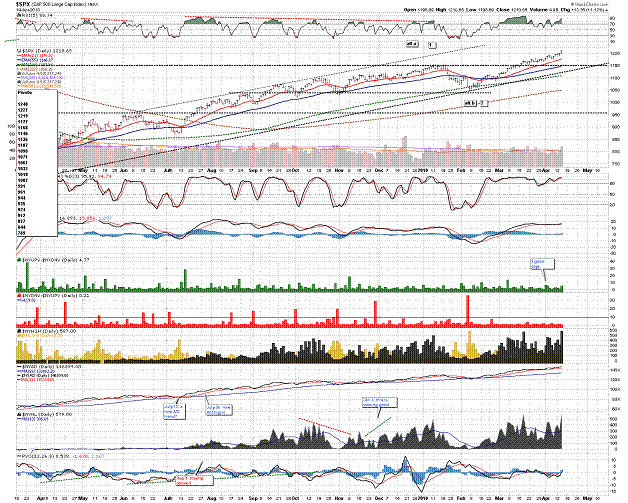
We had been watching a short term downtrend on McClellan Oscillator. Today, that downtrend was broken
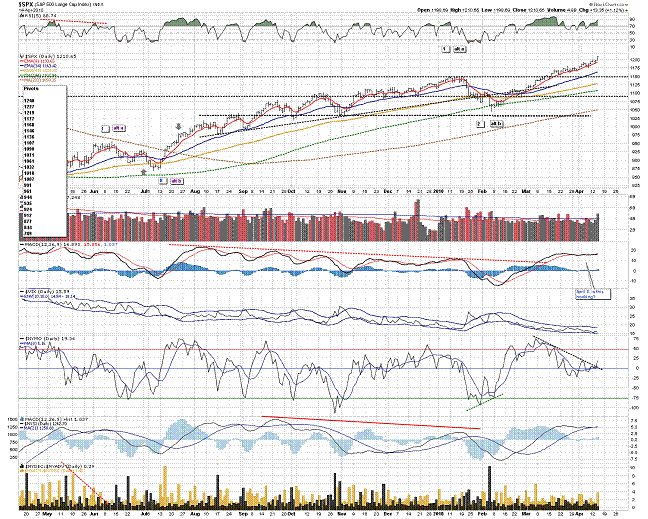
Despite the break in the downtrend of McClellan Oscillator, we have new price highs at lower breadth oscillator peaks. And we have spikes in momentum. So, as I have said before, price advanced while breadth expanded, and, now, volume appears. And, now that volume appears after so many points of price gain, maybe we are getting close to some sort of a top for this rally.
Just remember price is the most important indicator of all.
This is 60-min chart
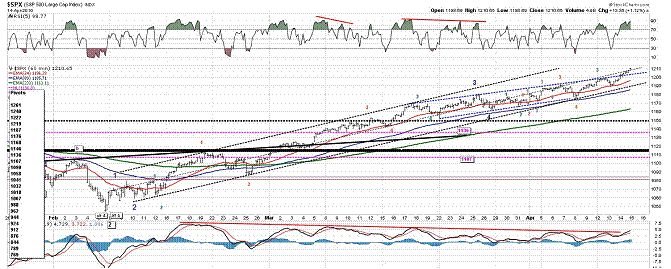
First off, don’t get caught in the minutiae of small waves. Pay attention to the bigger picture and price posture
Our channel has performed admirably guiding us along price movement. I had drawn a couple of blue lines that I thought might cap the price with some sort of diagonal. Index has clearly gone through it. Now, I like the upper blue line to offer a first area of support. It currently coincides with the 1200 area.
After that, a move below 1180 may be a warning for a correction and a change in short term trend.
After that, as long as index stays above 1160-1170 area, it’s either consolidating or rallying.
Pivot support is at 1187 and 1176. Pivot resistance is at 1222 and 1240.
Long term trend is up. Mid-term trend is up. Short term trend is up (a move below 1180 may change that).
Have a Nice Week!
By Piazzi
http://markettime.blogspot.com/
I am a self taught market participant with more than 12 years of managing my own money. My main approach is to study macro level conditions affecting the markets, and then use technical analysis to either find opportunities or stay out of trouble. Staying out of trouble (a.k.a Loss) is more important to me than making profits. In addition to my self studies of the markets, I have studied Objective Elliott Wave (OEW) under tutorship of Tony Caldaro.
© 2010 Copyright Piazzi - All Rights Reserved Disclaimer: The above is a matter of opinion provided for general information purposes only and is not intended as investment advice. Information and analysis above are derived from sources and utilising methods believed to be reliable, but we cannot accept responsibility for any losses you may incur as a result of this analysis. Individuals should consult with their personal financial advisors.
© 2005-2022 http://www.MarketOracle.co.uk - The Market Oracle is a FREE Daily Financial Markets Analysis & Forecasting online publication.


