Where Will the Food Come From to Satisfy China's Growing Consumption?
Commodities / Agricultural Commodities Apr 12, 2010 - 01:24 PM GMTBy: Ned_W_Schmidt
 While out this week shopping at your favorite food store, do something for one of your grandchildren. Use that fancy cell phone to take a few pictures of those food stores. Be sure to get several of the store front with people entering. With those pictures you may be able to convince your disbelieving descendants that a time did exist when grocery stores did not have armed guards.
Each day brings the world one day closer to global Agri-Food inadequacy. On one side demand around the world continues to rise as the number of people increases and higher incomes allow those in China and India to buy food on world markets. As we have written many times, China has demonstrated that hunger is not a problem of inadequate Agri-Food. Hunger can be cured by higher incomes that allow consumers to simply buy Agri-Food in world markets. Such is the approach being implemented in China, and they may have the money to outbid many.

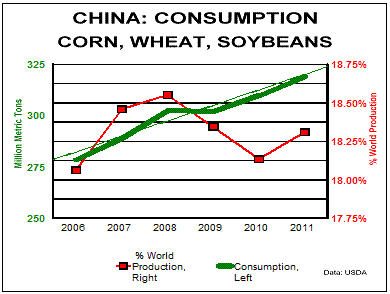
In our first chart above is plotted, using the green line and the left axis, China’s consumption of three of the most important grains. Shown is the sum of the corn, wheat, and soybeans consumed by people of China. Light green line is a linear regression, and the tight fit around that trend line should be noted. Historical data for this chart comes from the USDA, and that data was used to project 2011 values.
In the five years of the chart, China’s consumption of these grains will experience an increase of 40 million tons, or about 15%. To help put that quantity in perspective, the increase is greater than the total production of corn, wheat, and soybeans by Canada. Where will the world get another Canada with which to feed China over the next five years? And then, we will need another to feed India in the five years that then follow after.
Red line in that chart, using the right axis, is the percentage of the world’s production of corn, soybeans, and wheat consumed by China. In the Agri-Food price crazy year of 2008 that percentage reached 18.6%. 2009 was, according to the USDA, a great global crop year, and the ratio fell. USDA is now forecasting second year of good luck in the farm fields, and the ratio is expected to fall slightly again. In 2011, the USDA’s black hat of forecasts will probably be out of rabbits, and the ratio will rise back to 18.3%. The forecast difference between China’s share of global consumption of these three grains will be 0.3% shy of the 2008 level, when Agri-Food prices went up dramatically. And finally, note that China has about 20% of the world’s population. What happens to Agri-Food prices when, not if, they get their fair share?
In the past decade the world got lucky as the increased production of Argentinian and Brazilian farmers prevented the world from being either hungrier or paying more for the Agri-Food. In that decade those farmers increased the acreage growing soybeans or corn by about 15 million acres, or by about a third. In the past five years, the increased production of soybeans by Argentina and Brazil represented about 65% of the increase in global soybean production. In case you are wondering why that matters, every meal you consume every day includes some vegetable oil, one likely made from soybeans.

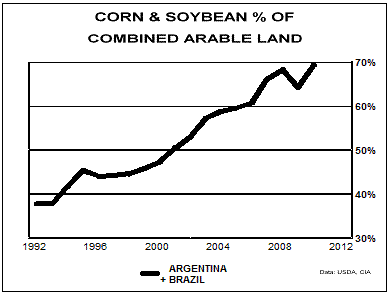
So much for history, what about the future? The above chart helps to understand the limits of Agri-Food. In the early 1990s, Brazil and Argentina used less than 40% of their combined arable land to produce corn and soybeans. In recent years, almost 70% of the arable land in those two nations was dedicated to producing corn and soybeans. A quite reasonable assumption is that those two nations will need to grow something besides corn and soybeans. Limits to growth in Agri-Food do exist, and they are measured in acres.
China will feed the nation in the years ahead as it will be generating the income with which to buy the necessary Agri-Food. However, the world does not have another Brazil and Argentina with which to keep Agri-Food prices from rising. And then in a few years, India will be in global Agri-Food markets buying also as incomes rise in that nation. Whether or not Agri-Food prices in the future will be higher is no longer a relevant question. Rather, how high will Agri-Food prices rise and how will the rest of the world afford the higher prices?
Agri-Food prices, as we have reported many times in these articles, have risen at a rate far faster than the return produced by equity markets. Even with Gold, your portfolio may not be adequate to feed your family in the coming years. To help investors understand the returns generated by Agri-Food commodities, we recently released our quarterly report on the topic, Agri-Food Commodities: An Investment Alternative. You may read that report at this link:
: http://www.agrifoodvalueview.com/files/Agri-Food_Commodites_An_Investment_Alternative_2010_April.pdf
By Ned W Schmidt CFA, CEBS
AGRI-FOOD THOUGHTS is from Ned W. Schmidt,CFA,CEBS, publisher of The Agri-Food Value View , a monthly exploration of the Agri-Food grand cycle being created by China, India, and Eco-energy. To receive the most recent issue of this publication, use this link: http://home.att.net/~nwschmidt/Order_AgriValue.html
Copyright © 2010 Ned W. Schmidt - All Rights Reserved
Ned W Schmidt Archive |
© 2005-2022 http://www.MarketOracle.co.uk - The Market Oracle is a FREE Daily Financial Markets Analysis & Forecasting online publication.


