SPX Stocks Index Nears 1200 Trend Reversal Level
Stock-Markets / Stock Markets 2010 Apr 12, 2010 - 02:28 AM GMTBy: Andre_Gratian
 Current Position of the Market
Very Long-term trend - Down! The very-long-term cycles are down and if they make their lows when expected, the bear market which started in October 2007 should continue until 2014.
SPX: Long-term trend - We are in a medium-term bull market, which is a corrective move within a long term bear market. This bull market should last until 2011
SPX: Intermediate trend - The Index is now nearing the 1200 level which is expected to bring about a reversal of the trend.
Analysis of the short-term trend is done on a daily basis with the help of hourly charts. It is an important adjunct to the analysis of daily and weekly charts which determines the course of longer market trends.
Daily market analysis of the short term trend is reserved for subscribers. If you would like to sign up for a FREE 4-week trial period of daily comments, please let me know at ajg@cybertrails.com .
Overview:
"The S&P 500 is on a mission to reach 1200 over the short-term." This is how the newsletter of two weeks ago started.
There was a projection to 1192 based on Point & Figure and 1200 based on Fibonacci since the move from the last phase of the advance started, after the correction to 1040.50 ended. Last Tuesday, the S&P 500 hit 1191.80 and pulled back sharply, suggesting that this might be the end of the trend. However, it quickly steadied itself, and on Friday it closed at 1194.66.
The short-term appears to have sufficient momentum to push to the 1200 target. And then what? It has been my experience that when a valid price projection is reached, a reversal occurs. I believe that 1200 (give or take a couple of points) is a valid projection. The method by which it was achieved has proven itself over time. There are also plenty of technical factors which support the need for at least a short-term top, including divergences in momentum (and especially in breadth indicators) and sentiment readings. We will analyze these in detail in this newsletter.
Whether a reversal at this level is of short or intermediate nature remains to be seen. Perhaps the high of the move will be made as early as next week, but an actual decline of consequence may not occur until a distribution phase has taken place. At this time, there is none because the move from 1040.50 has been straight up and there has not been a worthwhile correction for the past 9 weeks. While climactic bottoms such as the one we saw in March 2009 are frequent at the ends of major cycles as fear causes investors to lose all sense of proportion and becomes the only rationale for selling stocks, excessive optimism does not have the same effect at tops, and the "hope rally" which started last year is not likely to conclude without a distribution phase.
Analysis
Chart Pattern and Momentum
Let's start with the Weekly Chart. It gives us a very clear view of the longer trends in the market. The red channel represents the bear market from October 2007 to March 2009. The green channel is the path of the bull market which started when the bear ended.
Note that both channels are divided in two parts by a mid-channel line. Prices remained in the top part of the red channel for many weeks, and then, the decline accelerated and they fell into the lower half. After stabilizing, they worked their way back up to the top of the channel, hesitated for a while, and then rose completely out of it.
The green channel is different. It has the same basic, two-halves pattern, but prices moved to the top of the channel right away and stayed there. This is a sign of strength and it tells us that there is no indication whatsoever that this market is ready to reverse and go to new lows in the immediate future. Whether the bears like it or not, we are in a bull market -- for the time being. If anything, prices are threatening to go through the top of the channel line and revise the angle of the entire channel.
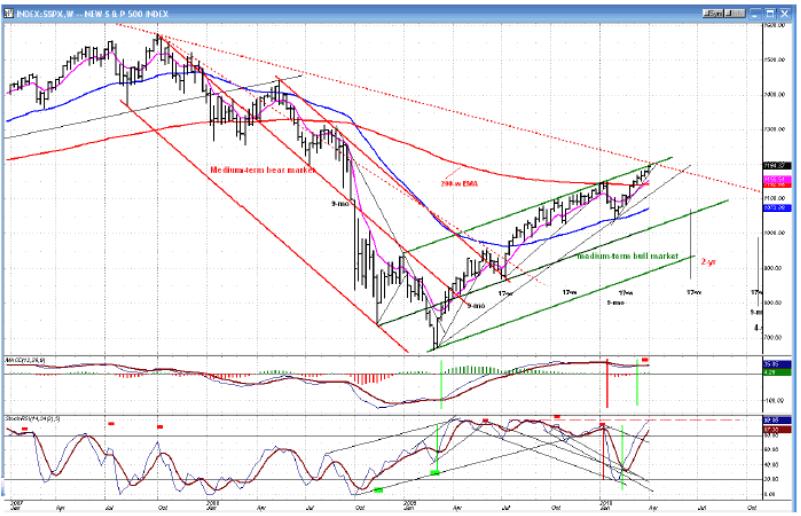
But this is not likely. First, we discussed the 1200 projection above. Second, the top line of a channel such at this provides some resistance and should push prices back, as it did previously in January.
Thirdly, the dotted red line from the top is also a very important resistance line. It acts as a Gann line, and if history repeats itself, it will stop prices from rising beyond it for a while. As you can see, we had a similar line at a steeper angle which stopped prices in June of last year, and it was only after a 4-week correction that the index was able to move through it. The market is much more overbought at this stage, and if the line provides the resistance that it should, it will be a while before prices can move above it. This is a good argument to make in favor of an important high, here. While it may be tested again in the future, it may not be surpassed.
Fourthly, we are concluding a 5 wave pattern which almost invariably brings about a correction, and we are doing so with one overbought momentum indicator and another in which negative divergence has appeared. And that's not all (as you will see later).
All these are arguments for the trend to stop at about 1200. They are not arguments for a reversal which would take the market to new lows. On the contrary! This is only likely to be a corrective pattern which could last until the Fall because of the cyclic configuration. A top to the bull market is not in sight.
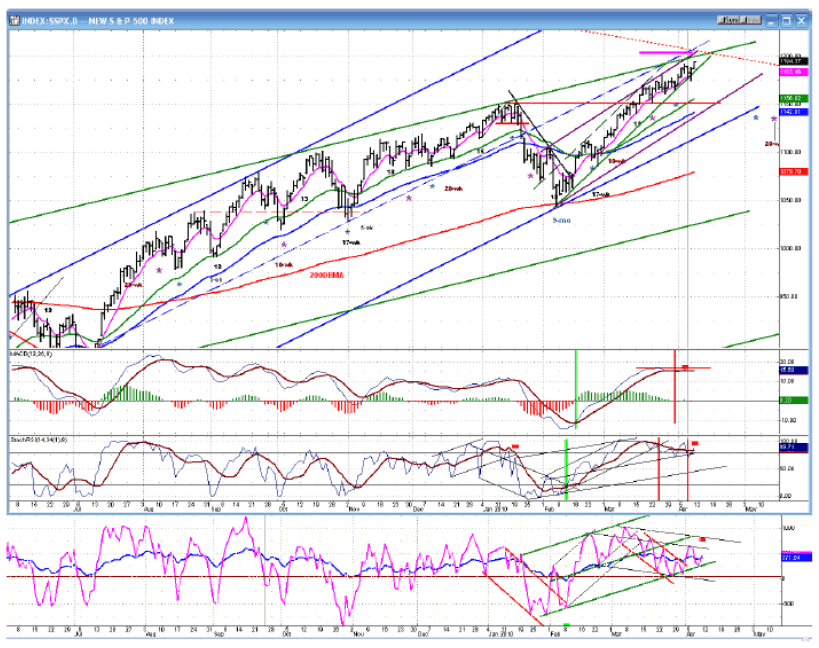
Next, we'll look at the Daily Chart (above).
It's the same story here. We have an overbought market which is nearing its projection target (pink horizontal line), as well as resistance provided by the top of the channel (green line) and the resistance line from the top (dotted red line).
The indicators are all showing negative divergence, and the lower indicator, which is an especially constructed oscillator of the advance/decline is already in a downtrend.
The only sign that remains in order to have a sell signal is for the index to close below the short-term uptrend line (which has already been violated once a couple of days ago), and to drop below the moving averages and out of the blue channel. This may take a little while, and this is where distribution at the top might form.
Finally, we look at the Hourly Chart for fine-tuning.
In the last three weeks, the index has been in a slight deceleration trend which is delineated by the blue channel. It has pulled away from the top of its green channel which goes back to the 1040.50 low, tested it successfully last Thursday, and is now moving once more toward the top of the channel and the 1200 target (pink line). In the process of testing both green and blue channel lows, it briefly broke through the black trend line which goes back to the low of the move and which is a valid trend line with three contact points. The next time through with an hourly close below 1183 may be the one that causes a reversal.
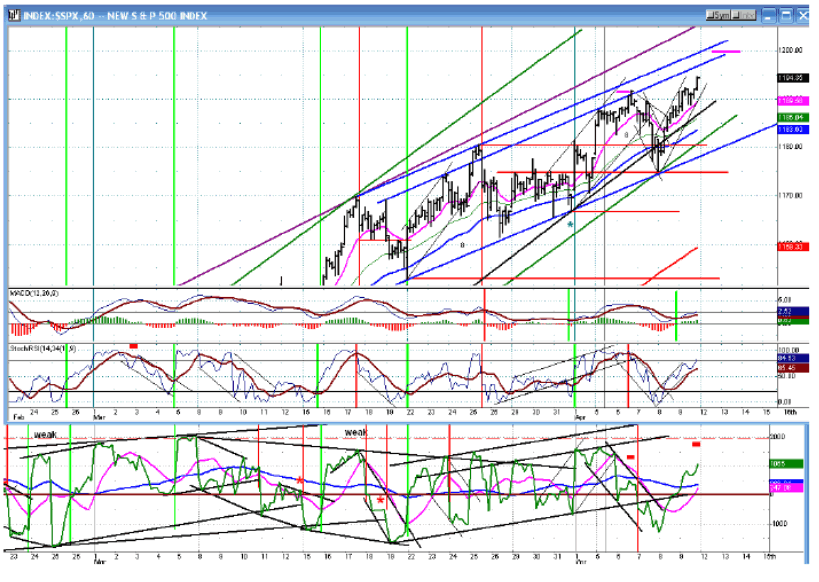
The hourly oscillators are still in an uptrend, but the A/D indicator which corresponds to the blue channel is showing negative divergence and has violated its channel. The next time these indicators turn down, it could spell the end of the trend.
Cycles
The important cycles, going forward, are best seen on the weekly chart. The first to make its low toward the end of June will be the 17-wk cycle, and it will do so just ahead of the 2-yr cycle. From this, we can probably assume that June and early July will be in a downtrend.
Before that, we have two small cycles bottoming in early May, and the 20-wk cycle about the middle of the month. It's hard to tell what effect this combination will have on the market and if it will be enough to pull it into a downtrend from this point on.
The lowest point of the correction should come in October with the 4-yr, 9-mo and 17-week cluster.
Projections:
There was a Point & Figure projection at 1192 which only caused a brief pull-back in the index. A more substantial one is a Fibonacci projection to 1200 which could be reached early next week. That one is also reinforced by a P&F count to 1200 across a small base formed at the end of May.
Breadth
The Summation Index (courtesy of StockCharts.com) has gone from sideways to slightly down for the past two weeks, while the RSI remains overbought. This slight negative divergence is caused by a refusal to support higher levels in the market.
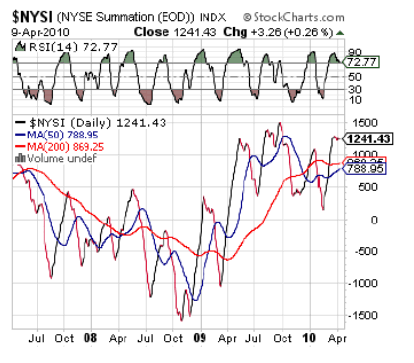
You can see that the sideways move on the SI actually translates to significant divergence when we look at a daily chart indicator of the A/D, above.
Market Leaders and Sentiment
By looking at the SentimenTrader (courtesy of same) we can see the pronounced deterioration in long-term sentiment that has taken place in the stock market. From bullish at the beginning of the 1040.50 rally, it has grown steadily more bearish, to one of its worst levels in recent memory. This type of reading is normally associated with an important top.
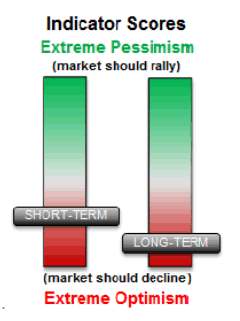
Another slight negative is that new highs were down by a good margin vs. a month ago.
Summary
After Friday's close, my 1200 target in now only 5 points away. Several technical and sentiment considerations suggest that reaching this level could lead to a significant reversal of the SPX trend, and caution is advised.
On the other hand, significant distribution does not exist which implies that the index could spend some time trading in this general area before an intermediate decline begins.
If precision in market timing is something which is important to you, you should consider a trial subscription to my service. It is free, and you will have four weeks to evaluate the claims made by the following subscribers:
Awesome calls on the market lately. Thank you. D M
Your daily updates have taken my trading to the next level. D
… your service has been invaluable! It's like having a good technical analyst helping me in my trading. SH
I appreciate your spot on work more than you know! M
But don't take their word for it! Find out for yourself with a FREE 4-week trial. Send an email to ajg@cybertrails.com .
By Andre Gratian
MarketTurningPoints.com
A market advisory service should be evaluated on the basis of its forecasting accuracy and cost. At $25.00 per month, this service is probably the best all-around value. Two areas of analysis that are unmatched anywhere else -- cycles (from 2.5-wk to 18-years and longer) and accurate, coordinated Point & Figure and Fibonacci projections -- are combined with other methodologies to bring you weekly reports and frequent daily updates.
“By the Law of Periodical Repetition, everything which has happened once must happen again, and again, and again -- and not capriciously, but at regular periods, and each thing in its own period, not another’s, and each obeying its own law … The same Nature which delights in periodical repetition in the sky is the Nature which orders the affairs of the earth. Let us not underrate the value of that hint.” -- Mark Twain
You may also want to visit the Market Turning Points website to familiarize yourself with my philosophy and strategy.www.marketurningpoints.com
Disclaimer - The above comments about the financial markets are based purely on what I consider to be sound technical analysis principles uncompromised by fundamental considerations. They represent my own opinion and are not meant to be construed as trading or investment advice, but are offered as an analytical point of view which might be of interest to those who follow stock market cycles and technical analysis.
Andre Gratian Archive |
© 2005-2022 http://www.MarketOracle.co.uk - The Market Oracle is a FREE Daily Financial Markets Analysis & Forecasting online publication.
Comments
|
Cal
15 Apr 10, 10:14 |
So what now?
Andre What does the current break out above 1210 SPX500 do for your prediction of a turndown? What support does 1200 now offer? Cal |


