


Indian Stock Market Technical Analysis
Stock-Markets / India Apr 11, 2010 - 12:09 PM GMTBy: StocksBuddy

 Previous Week: Last Week Nifty made yet another new high, but barely closed above previous weeks close. The bullishness continued throughout the week with just a single session in red. All the indicators have been in Overbought territory for a while now. This has been the case for almost all of the world indices.
There has been some divergences seen in other parts of the world. While Shanghai index was breaking out last week, other world indices were relatively flat-to-positive.
Technically Speaking:
Take a look at the Daily Nifty chart below.
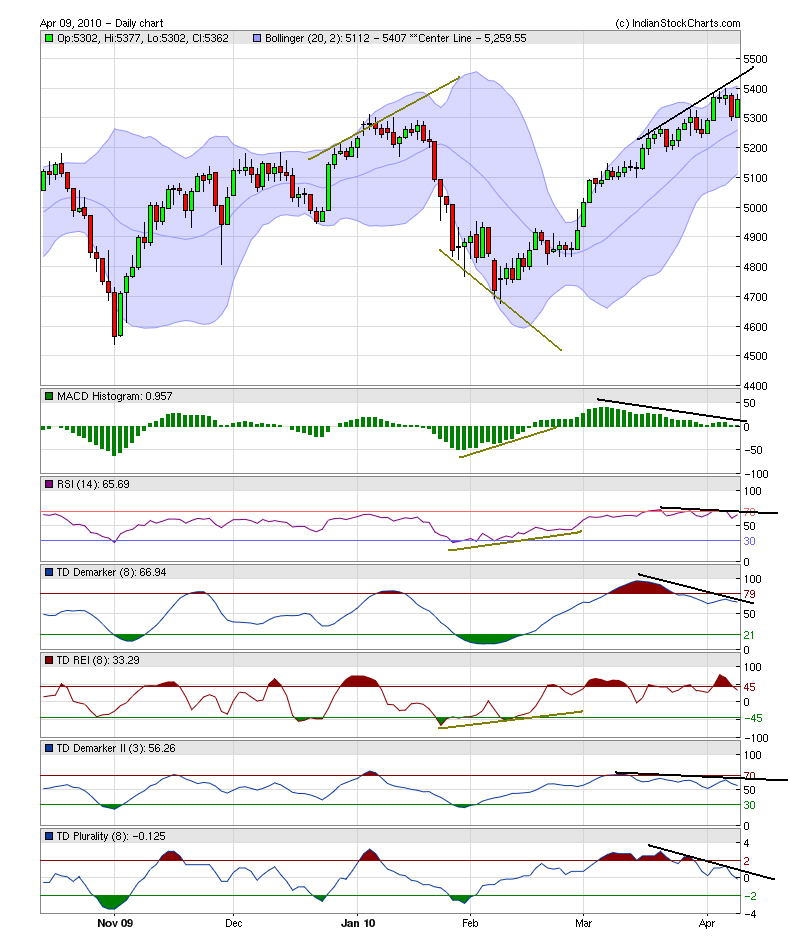
The above chart uses TD Demark indicators extensively.
Positives:
1.RSI Still Extremely strong and is above 50.
2.Nifty is close to its 52 week highs. Momentum is excellent.
3.MACD histogram still in positive territory.
4.Bollinger Bands Continue to show extreme Strength.
Negatives:
1.All of the indicators have negative divergences. Picture says 1000 words. You cannot really find a perfect example of divergences than the chart above. In the above chart Nifty was actually MOVING DOWN in late jan and early feb, while MOST of the indicators were either already moving up or were having POSITIVE divergences as marked. Price moves down and indicators moving up or having divergence is extremely positive. See what happened next. Nifty rallied nearly 15% after that. Cut to this week. Nifty is making new highs each week YET, all of the indicators are either moving down or are showing Clear negative divergences. Price tends to follow the indicators.
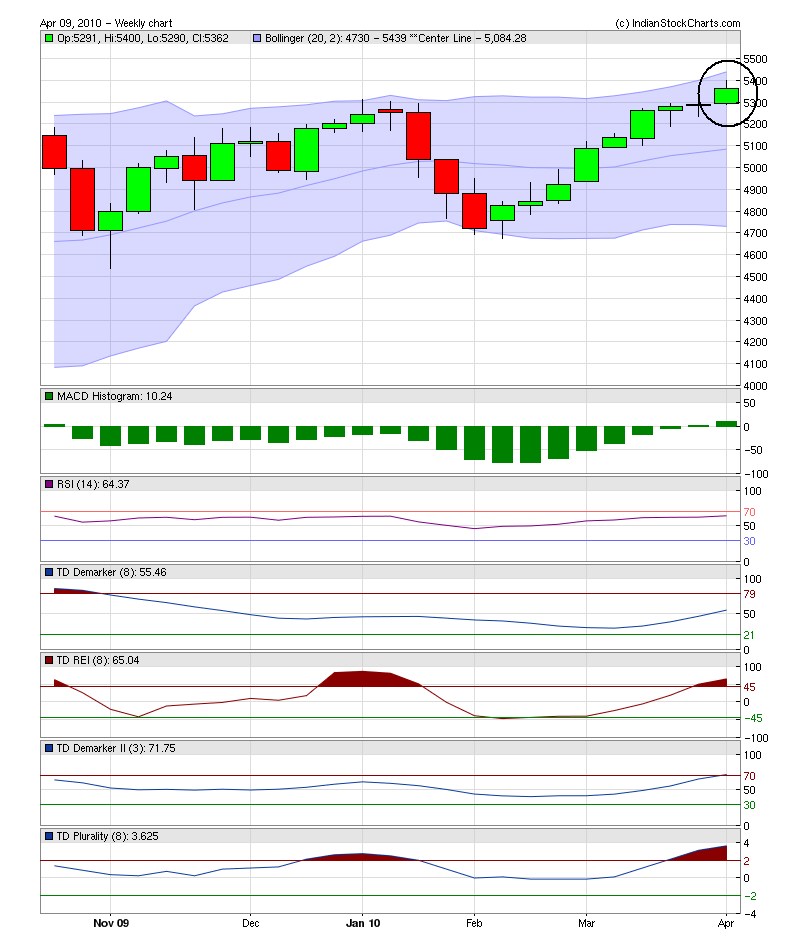
2.Take a look at the weekly chart below. It looks like a “Shooting Star”, circled in the chart. This pattern has about 60% chances of a Bearish reversal. With extremely overbought markets and a bearish candlestick chances are we make be nearing an end of the rally.
Next Week:
Market, even though looks very shaky, there are really NO confirmation signals yet that the trend has changed and that we will go down next week. Hence, the outlook for coming week is similar to last week. Stay bullish with extremely tight stops if you are long. Do NOT initiate short positions yet.
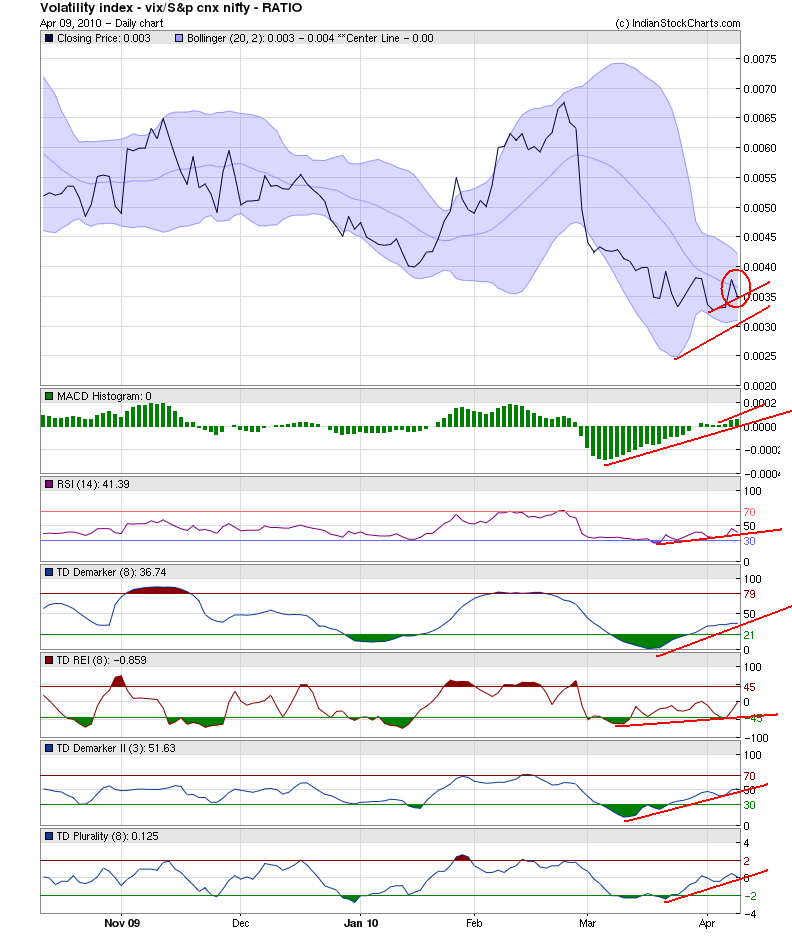
The chart below is the ratio chart of Indian VIX (Volatility index) to Nifty. This chart shows the correlation between Volatility and the moves in Nifty. The lower this chart, the higher the chances for Nifty to move up and vice-versa. This chart tells another story altogether. This ratio chart has actually started moving up and as you can see, almost ALL indicators have resumed their uptrend with positive divergences all over the place. If this ratio crosses .004, then be rest assured that the correction has begun.
Since we are so close to tipping point with so many negative indicators all over the place, the best strategy for next week would be to sit tight on cash rather than initiating either a new long or short position and watch what market does. As always, you will have plenty of time to catch the trend in either direction.
Have a Wonderful Trading Week ahead.
Regards
India's No.1 Trading Community From the desk of StocksBuddy.com Analysts comes the above article. SB Analyst team comprises of experts from varied fields such as Technical Analysis, Fundamental Analysis, Macro-Micro Economics, World Affairs, Currency and much more. Apart from user contributions, our analysts post analysis on StocksBuddy.com on a regular basis. For more details, please visit us @ http://www.stocksbuddy.com/blogs
© 2009 Copyright StocksBuddy - All Rights ReservedDisclaimer: The above is a matter of opinion provided for general information purposes only and is not intended as investment advice. Information and analysis above are derived from sources and utilising methods believed to be reliable, but we cannot accept responsibility for any losses you may incur as a result of this analysis. Individuals should consult with their personal financial advisors.
© 2005-2022 http://www.MarketOracle.co.uk - The Market Oracle is a FREE Daily Financial Markets Analysis & Forecasting online publication.