How Much Do You Really Pay for Social Security?
Politics / Government Spending Apr 06, 2010 - 04:24 PM GMTBy: Casey_Research

 Vedran Vuk, Casey Research writes:
Every generation scolds the next one down the line and blames society’s ills on the guy up at bat. Considering past policy decisions, this common perspective doesn’t make much sense. Just look at the Great Depression generation, both known for its great character as well as the worst policies of the century. Clearly, older generations did not always make the best decisions.
One of those bad decisions, Social Security, still haunts America today like the grim reaper waiting to take his harvest. It’s strange to think the same men who courageously stormed the beaches of Normandy didn’t have the political courage to dismantle this ticking time bomb. If it wasn’t for WWII veterans, many believe that this article would be written in German. That might be true. But due to an exploding national debt and that generation’s failure with Social Security, we’ll be speaking Chinese sooner than German.
The lack of political will isn’t surprising since most past retirees were net gainers from Social Security while new retirees are net losers. Older folks love bemoaning runaway spending, welfare queens, and handouts. But often they don’t consider their own gains from the welfare state.
As Social Security taxes increased over time, so did the benefits. Essentially, previous generations paid into the system when taxes were low and retired when the benefits were high. A retiree’s maximum tax loss from Social Security in 1940 was $923 in today’s dollars. Compare this to the current maximum of $13,243.
To find the dividing line between net gainers and losers, we created a projection assuming an individual with a salary equaling the top taxable Social Security limit for 45 years (to get an idea of this amount, consider the limit was $3,000 dollars in 1940 and $106,800 in 2010 – both nice salaries). Our test dummy paid the maximum Social Security taxes every year.
On the other hand, upon retirement, he would receive maximum benefits. According to the Social Security Administration, maximum taxation is a prerequisite to maximum payouts. Next, we added Social Security benefits received over 13 years (derived from the average U.S. life expectancy of about 78). Finally, we calculated the difference between taxes paid over 45 years and the payouts received for 13. The results were shocking.
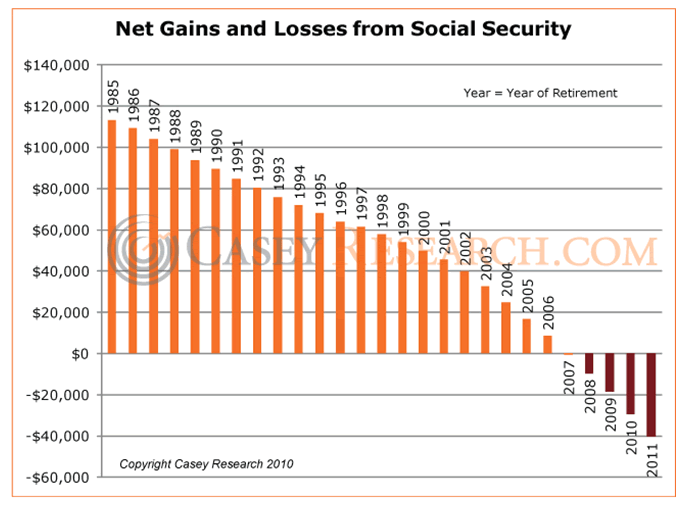
Before 2007, our projected retirees were net gainers from Social Security. 2007 retirees were the first net losers at -$411. By 2011, retirees will be -$40,403 in the red.
In the ‘80s, a Greatest Generation survivor retiring at 66 in 1985 received a net gain over his expected lifespan of $113,350 in 2010 dollars. Just a decade down the road, a 1995 retiree still profited by $67,982.

While welfare is often equated with public housing residents, perhaps nursing home residents should be considered too. These Social Security payments outweigh many welfare handouts. For example, California’s maximum TANF (welfare) payments for a family of three were $9,373 a year in 2005, inflation-adjusted for today. It takes over 12 years of welfare to equal the 1985 retirement net gain. (To be fair, if housing subsidies, food stamps, and other benefits were included, the number of years would be lower.)

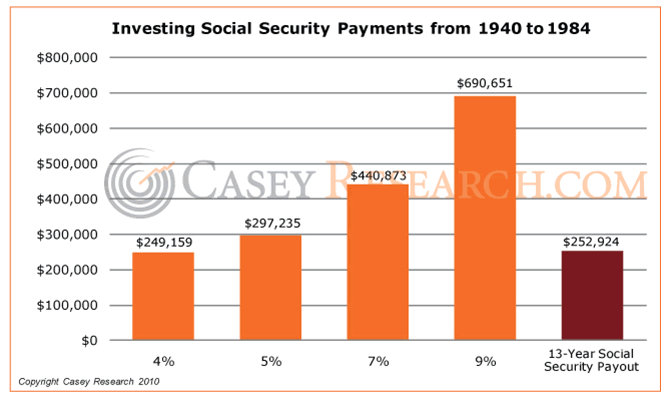
So, are pre-2007 retired generations complete bums? Well, not exactly. It depends on how the money would have been spent otherwise. Suppose that instead of paying Social Security, the same amounts had been placed into an account earning five percent a year.
After 45 years starting in 1940 and ending in 1984, this account would have been worth over $297,000 in 2010 dollars. This is $44,000 more than 13 years of Social Security benefits starting in 1985.
Hence, older retirees are bums on a case-by-case basis. An investment-savvy penny-pincher would have lost from Social Security. Without the program, he could have invested privately. But spendthrift retirees benefitted enormously. The responsible saver is punished and the careless spender rewarded – the same old story of welfare retold for an older generation.
[And this note as an afterthought:
How Much Do You Really Pay for Social Security?
The government has pulled a fast one on most people. You pay half the Social Security tax and your employer pays the second half, right? No, wrong. You actually pay both.
Let’s go through this example to understand the point. Let’s say that a person earns $100,000 a year and pays $6,000 in Social Security taxes and the employer pays $6,000. In the eyes of the employer, the person’s services are worth $106,000 ($100,000 salary + $6,000 in Social Security taxes), that’s how much he costs the employer.
Now, imagine what would happen if Social Security taxes disappeared overnight. For a little while, the employer would profit by paying $100,000 for an employee worth $106,000. However, in a free market, prices move toward levels equaling the underlining value. Just like good underpriced stocks will eventually move up, so does the price for good undervalued employees – although, both may not be immediately appreciated.
Eventually, the person’s wages would be bid up in the market from $100,000 to $106,000. Because of this, the employer’s half is actually your half too. Without Social Security, your wages would be close to your value to the employer, in this case, $106,000. So, in reality, the person pays $6,000 in taxes and makes $6,000 less than he would in a completely free market, meaning that the real loss is $12,000 per year.
This is the kind of stuff the editors of The Casey Report spend sleepless nights over. Where is the economy going? How much does politics influence the markets, and in which direction? How can we profit? Answers to these and more burning questions you’ll find in the March edition of The Casey Report… with Bud Conrad’s musings on “The Point of No Return.” Is the U.S. economy beyond repair? Find out with our risk-free 3-month trial. More here.
© 2010 Copyright Casey Research - All Rights Reserved
Disclaimer: The above is a matter of opinion provided for general information purposes only and is not intended as investment advice. Information and analysis above are derived from sources and utilising methods believed to be reliable, but we cannot accept responsibility for any losses you may incur as a result of this analysis. Individuals should consult with their personal financial advisors.
© 2005-2022 http://www.MarketOracle.co.uk - The Market Oracle is a FREE Daily Financial Markets Analysis & Forecasting online publication.
Comments
|
albert muller
16 Jan 12, 18:01 |
paid into social security
How can I determine how much I paid into social security in my lifetim? |


