


The 'PAIN' In Precious Metals Stocks!
Commodities / Gold & Silver Stocks Aug 16, 2007 - 01:16 AM GMT
 If you're reading this article we likely know how you're feeling about your investments. You probably feel a little anxious, uncomfortable, worried, you may be thinking about selling or you have recently sold some of your investments. You may not be adding to positions or you may have stopped viewing your trading account because you do not want to see your accounts performance.
How do we know this?
1. Most of our readers are interested in 'contrarian' investments and likely own a fair amount of mining equities.
2. Out of fifty mining stocks we have recently observed, forty nine of them have a lower share price today than they did 30 days ago. This means only 2% are higher than they were a month ago, or 98% of these stocks are lower than they were a month ago.
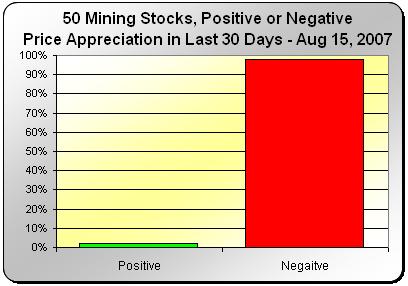
3. So even if you saw good value in mining equities and waited for the anticipated seasonally weaker summer months to purchase your shares, there is a pretty good chance that your investments are in a losing position. If you purchased earlier you may really be hurting.
Ouch!
You are not alone. There are millions of other novice and professional investors feeling exactly the same. So what do we do in these situations? How do we keep our emotions under control? The most important questions we can ask ourselves are:
Are commodities and therefore precious metals still in a long term, major bull market?
Has the major up trend in precious metals changed?
In our opinion investing can be remarkably simple and these are very key questions. Why is this important? We believe that observing extreme signals such as the example given above is generally a good time to add to ones positions if we think that we are still in a major bull market. In a major bull market we consider this bullish as it is a signal of very negative sentiment. However, if we determine that the bull market in commodities is over then it would be considered a bearish signal.
Are we still in a bull market?
We use custom designed long term timing charts to help us answer questions such as these. Basically we think stock charts priced in currencies such as US dollars can be a confusing measuring stick since the currency significantly fluctuates and distorts the charts signals. Also, so many investors are looking at the same currency measured chart that the signals become less effective. If millions of people controlling billions of dollars are viewing the same charts that we are, how can we predict what will happen better than the others? What do we know that they don't?
There are many ways to measure an assets value and we prefer to measure one investment directly to other investments. In doing so, we bypass the distortion of the measuring stick, the US dollar, and directly compare one asset class to another. This way, we gain a unique perspective on our investment. Our custom built signals are based on this principle.
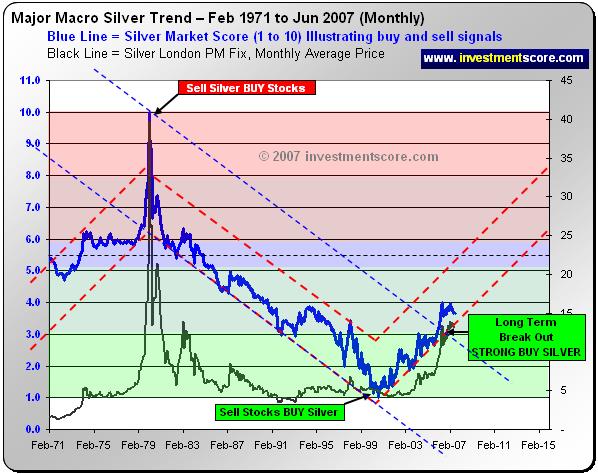
The black line in the above chart is the price of silver and the blue line is a long term custom built timing signal. When the blue line is trending higher, silver is outperforming US stocks, and when the blue line is trending lower, US stocks are outperforming silver. Basically, since roughly 2000 the above blue line illustrates the flow of capital from US stocks into silver bullion. Generally, we prepare to add to long term silver positions while the blue line is in the lower half of the chart and trending higher. We prepare to scale out of long term silver positions as the blue line approaches the upper portion of the chart or if it significantly breaks its long term up trend.
Based on the above chart, we believe silver is still in a long term up trend. We are not aware of excess supplies of silver and we see evidence of rising prices and interest rates. We think the public is generally not aware of the commodities bull market. In our opinion most investors do not understand commodities as an investment class, are skeptical and have not yet added to positions in this market. US stock markets and fixed income markets are experiencing turmoil. The current super power, the United States, is at war and in an unpopular position world wide. August is generally a weak time of year for commodities and lower prices should be expected. In our opinion the silver and gold markets price action is acting as we would expect in these conditions. We believe the long term bull market in commodities is not over and therefore we are adding to our favorite silver investments on price weakness.
This is not the time to let your emotions take control of your decisions. Look at the data, follow your strategies, follow your signals, use your common sense, observe market behaviors, do your due diligence and do not get caught up in the hype.
If you would like to learn more about our custom built signals and strategy, please visit us at www.investmentscore.com . Here you will find many more custom built timing charts, similar to the one used in this article. If you enjoyed this article, you may also subscribe to our free newsletter.
By Michael Kilback
Investmentscore.com
Investmentscore.com is the home of the Investment Scoring & Timing Newsletter. Through our custom built, Scoring and Timing Charts , we offer a one of a kind perspective on the markets.
Our newsletter service was founded on revolutionary insight yet simple principles. Our contrarian views help us remain focused on locating undervalued assets based on major macro market moves. Instead of comparing a single market to a continuously moving currency, we directly compare multiple major markets to one another. We expect this direct market to market comparison will help us locate the beginning and end of major bull markets and thereby capitalize on the largest, most profitable trades. We pride ourselves on cutting through the "noise" of popular opinion, media hype, investing myths, standard over used analysis tools and other distractions and try to offer a unique, clear perspective for investing.
Disclaimer: No content provided as part of the Investment Score Inc. information constitutes a recommendation that any particular security, portfolio of securities, transaction or investment strategy is suitable for any specific person. None of the information providers, including the staff of Investment Score Inc. or their affiliates will advise you personally concerning the nature, potential, value or suitability or any particular security, portfolio of securities, transaction, investment strategy or other matter. Investment Score Inc. its officers, directors, employees, affiliates, suppliers, advertisers and agents may or may not own precious metals investments at any given time. To the extent any of the content published as part of the Investment Score Inc. information may be deemed to be investment advice, such information is impersonal and not tailored to the investment needs of any specific person. Investment Score Inc. does not claim any of the information provided is complete, absolute and/or exact. Investment Score Inc. its officers, directors, employees, affiliates, suppliers, advertisers and agents are not qualified investment advisers. It is recommended investors conduct their own due diligence on any investment including seeking professional advice from a certified investment adviser before entering into any transaction. The performance data is supplied by sources believed to be reliable, that the calculations herein are made using such data, and that such calculations are not guaranteed by these sources, the information providers, or any other person or entity, and may not be complete. From time to time, reference may be made in our information materials to prior articles and opinions we have provided. These references may be selective, may reference only a portion of an article or recommendation, and are likely not to be current. As markets change continuously, previously provided information and data may not be current and should not be relied upon.
Investmentscore.com Archive |
© 2005-2022 http://www.MarketOracle.co.uk - The Market Oracle is a FREE Daily Financial Markets Analysis & Forecasting online publication.