Stock Market Up Or Down Get Your Watch List Ready
Stock-Markets / Stock Markets 2010 Apr 03, 2010 - 02:28 PM GMTBy: David_Grandey
 The theme over the past week or so has been that of no follow through and no decisiveness.
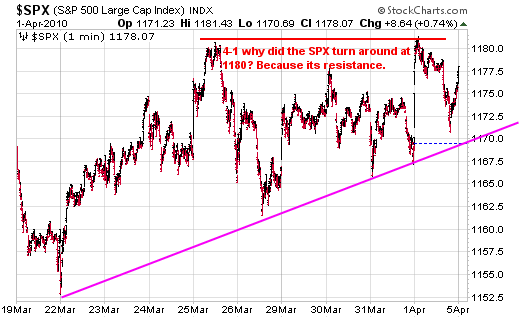
Earlier in the week we said we'd rather get that 1180 level out of the way and here we are tagging 1180 into the holiday. So now the moment of truth. Do we stall here? Or is it away we go to the 1226 level on the S&P 500. We'll find out some time next week. The big matrix computers make that call.

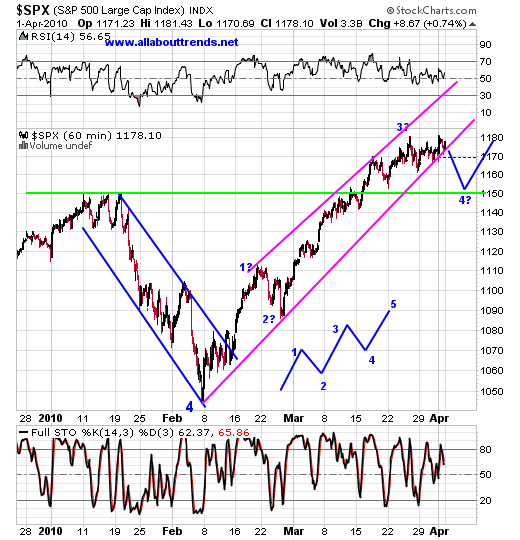
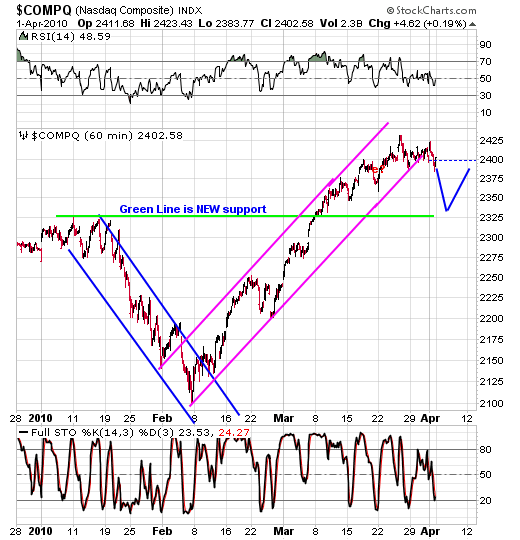
We are looking for a lasting trend change, something that we can sink our teeth into. With regards to the indexes we need to see a decisive break of the uptrend. However in our 60-minute charts below we have support levels at the green lines to contend with first.
If we are going to top we can see one of two scenarios to be on the lookout for from here over the next few weeks because we all know this Sham Wow market can't do this all year.
Scenario 1: It will be on a rally attempt after a tag of those green support levels as shown in the blue lines below.


WHAT DOES THIS SCENARIO MEAN TO YOU?
Simple:
In scenario 1 above the game plan for us is to buy stocks that have pulled back off of their highs or are in clearly defined uptrends pulling back to support levels or the 50 day average. That's where our longside watch list comes into play.
We would much rather be buying stocks on pullbacks vs. chasing stocks because we've been here before and after you get these nosebleed moves like this in an up up and away with no pullbacks to speak of environment it makes it awful hard to trade long on the long side.
Currently on the longside? The over extended get more over extended (APKT, CLF, AAPL) and the ones that do trigger really don't get much follow through these days as we've seen.
Even breakouts are questionable these days as we've see a fair amount of them breakout and get turned back fast (ATHR, DWA, VOLC, $SOX).
On the longside it's really about sticking to our discipline of not chasing stocks. We'd much rather trade off of quality patterns.
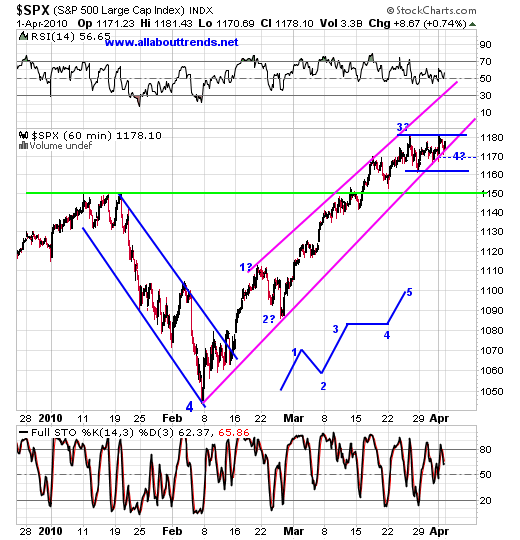
Scenario 2: Typically there is a rule of thumb with waves and that is that if wave 2 is traditional (and this one was) then wave 4 can be sideways and vice versa. IF this is the case then we have another move higher early next week which would look the diagram in the chart below.

WHAT DOES THIS SCENARIO MEAN TO YOU?
Simple:
It means just more of the same we've seen the last week or so which is the extended get even more extended and it also means its the 5th wave of the 5th wave to end this whole bear market rally.
That's where the shortside watch list comes into play.
By David Grandey
www.allabouttrends.net
To learn more, sign up for our free newsletter and receive our free report -- "How To Outperform 90% Of Wall Street With Just $500 A Week."
David Grandey is the founder of All About Trends, an email newsletter service revealing stocks in ideal set-ups offering potential significant short-term gains. A successful canslim-based stock market investor for the past 10 years, he has worked for Meriwest Credit Union Silicon Valley Bank, helping to establish brand awareness and credibility through feature editorial coverage in leading national and local news media.
© 2010 Copyright David Grandey- All Rights Reserved Disclaimer: The above is a matter of opinion provided for general information purposes only and is not intended as investment advice. Information and analysis above are derived from sources and utilising methods believed to be reliable, but we cannot accept responsibility for any losses you may incur as a result of this analysis. Individuals should consult with their personal financial advisors.
© 2005-2022 http://www.MarketOracle.co.uk - The Market Oracle is a FREE Daily Financial Markets Analysis & Forecasting online publication.


