Most Popular
1. It’s a New Macro, the Gold Market Knows It, But Dead Men Walking Do Not (yet)- Gary_Tanashian
2.Stock Market Presidential Election Cycle Seasonal Trend Analysis - Nadeem_Walayat
3. Bitcoin S&P Pattern - Nadeem_Walayat
4.Nvidia Blow Off Top - Flying High like the Phoenix too Close to the Sun - Nadeem_Walayat
4.U.S. financial market’s “Weimar phase” impact to your fiat and digital assets - Raymond_Matison
5. How to Profit from the Global Warming ClImate Change Mega Death Trend - Part1 - Nadeem_Walayat
7.Bitcoin Gravy Train Trend Forecast 2024 - - Nadeem_Walayat
8.The Bond Trade and Interest Rates - Nadeem_Walayat
9.It’s Easy to Scream Stocks Bubble! - Stephen_McBride
10.Fed’s Next Intertest Rate Move might not align with popular consensus - Richard_Mills
Last 7 days
S&P Stock Market Trend Forecast to Dec 2024 - 16th Apr 24
No Deposit Bonuses: Boost Your Finances - 16th Apr 24
Global Warming ClImate Change Mega Death Trend - 8th Apr 24
Gold Is Rallying Again, But Silver Could Get REALLY Interesting - 8th Apr 24
Media Elite Belittle Inflation Struggles of Ordinary Americans - 8th Apr 24
Profit from the Roaring AI 2020's Tech Stocks Economic Boom - 8th Apr 24
Stock Market Election Year Five Nights at Freddy's - 7th Apr 24
It’s a New Macro, the Gold Market Knows It, But Dead Men Walking Do Not (yet)- 7th Apr 24
AI Revolution and NVDA: Why Tough Going May Be Ahead - 7th Apr 24
Hidden cost of US homeownership just saw its biggest spike in 5 years - 7th Apr 24
What Happens To Gold Price If The Fed Doesn’t Cut Rates? - 7th Apr 24
The Fed is becoming increasingly divided on interest rates - 7th Apr 24
The Evils of Paper Money Have no End - 7th Apr 24
Stock Market Presidential Election Cycle Seasonal Trend Analysis - 3rd Apr 24
Stock Market Presidential Election Cycle Seasonal Trend - 2nd Apr 24
Dow Stock Market Annual Percent Change Analysis 2024 - 2nd Apr 24
Bitcoin S&P Pattern - 31st Mar 24
S&P Stock Market Correlating Seasonal Swings - 31st Mar 24
S&P SEASONAL ANALYSIS - 31st Mar 24
Here's a Dirty Little Secret: Federal Reserve Monetary Policy Is Still Loose - 31st Mar 24
Tandem Chairman Paul Pester on Fintech, AI, and the Future of Banking in the UK - 31st Mar 24
Stock Market Volatility (VIX) - 25th Mar 24
Stock Market Investor Sentiment - 25th Mar 24
The Federal Reserve Didn't Do Anything But It Had Plenty to Say - 25th Mar 24

Market Oracle FREE Newsletter

How to Protect your Wealth by Investing in AI Tech Stocks

The U.S. Jobs Report, Stock Market Rally or Finale?

Stock-Markets / Stock Markets 2010 Apr 02, 2010 - 02:16 AM GMT

By: Steven_Vincent

Stock-Markets

Best Financial Markets Analysis ArticleBullBear Trading Service members have been following my charts and posts as we approached the US Non-Farm Payrolls report to be issued on Friday morning.  It seems as though the entire future of the market is pending on this single news item.  This is, of course, known to be an economic release which tends to move the markets.  Or does it?


I would contend that regardless of the content of the report, the market's reaction to it has been already set by underlying conditions.  It is not the news which moves the market.  The news is a catalyst that unleashes pent up buying or selling power.  That energy is already present and latent and awaiting a reason.  If a forest is wet with rain and verdant, a camper cannot burn it down with a hundred carelessly tossed matches.  If it is dry and hot then a single spark can set it ablaze.  All depends upon the quality of underlying conditions.  The news is but a lit match.

Will I have my ear glued to Bloomberg at 5:30 AM PST?  Sure.  But I will be watching not for the content of the news but for the market's reaction to it.  Does it initially sell on "bad news" and then rally?  Does it initially rally on "good news" and then sell off?  Does technical support hold or give way with ease?  These are the kinds of questions that the experienced trader asks himself.

My work at this time indicates that we are presently in a wave iv correction of the 5th wave of the first wave of a primary bull market.  So we are on the brink of entering the 5th of the 5th of the 1st wave in a new bull market.  My analysis is incomplete, but a look at breadth and sentiment indicators seems to indicate that the volatile sideways action of the last 2 weeks has done the job of working off much of the overbought condition and excessive bullish sentiment that existed.  My tape reading shows that there are sufficient buyers anxiously trying to establish a long term position and they have been trading places with the shorter term players.  So my sense of underlying conditions is that, regardless of the news tomorrow and irrespective of the immediate reaction, the market will be higher a week from now than it is today.  (And no, I am not married to this conclusion and will reconsider this if and when market action dictates).

Let's have a look at the SPX and two distinct possibilities for the completion of this wave iv corrective wave.  So far I do not have a wave count or analysis that accommodates a topping scenario.  Should the market violate 1150 on a close then I will certainly be examining that scenario.

THE EXPANDED FLAT

In expanded flats, wave B of the 3-3-5 pattern terminates beyond the starting level of wave A, and wave C ends more substantially beyond the ending level of wave A.


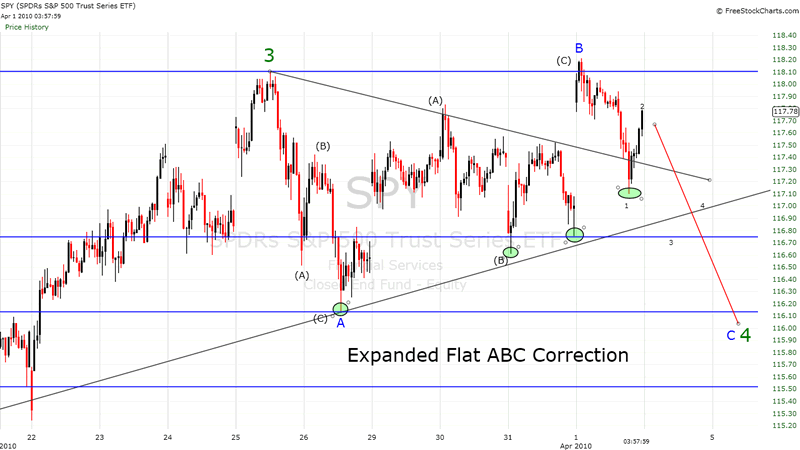
My guess is that, regardless of the news, the market is still a tad top heavy with sellers who want to take profits (and shorts who are ...well...anxious more pain) and so the inital reaction will be a sell off to support.  I expect buyers to take the other side of that reaction and bid the market higher.  An intraday upside reversal is possible, or it could take a few days.  I view this as the stronger possibility of the two presented here.

THE RUNNING FLAT

In a rare variation on the 3-3-5 pattern, which we call a running flat, wave B terminates well beyond the beginning of wave A as in an expanded flat, but wave C fails to travel its full distance, falling short of the level at which wave A ended. Apparently in this case, the forces in the direction of the larger trend are so powerful that the pattern becomes skewed in that direction. It is always important, but particularly when concluding that a running flat has taken place, that the internal subdivisions adhere to Elliott's rules. If the supposed B wave, for instance, breaks down into five waves rather than three, it is more likely the first wave up of the impulse of next higher degree. The power of adjacent impulse waves is important in recognizing running corrections, which tend to occur only in strong and fast markets. We must issue a warning, however. There are hardly any examples of this type of correction in the price record. Never label a correction prematurely this way, or you'll find yourself wrong nine times out of ten.


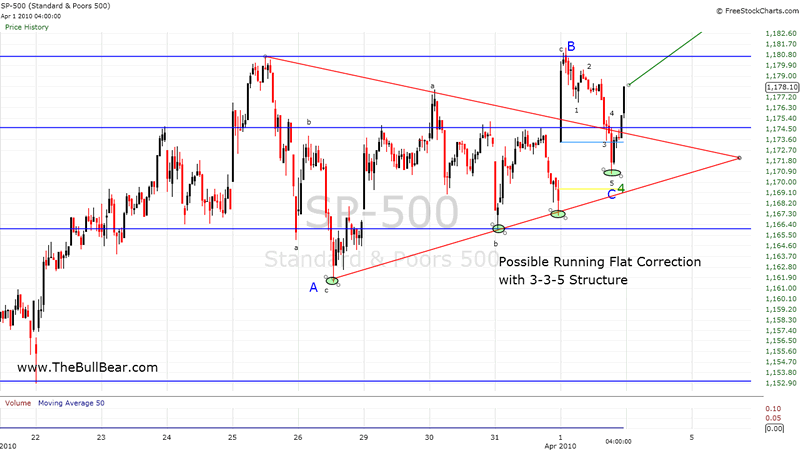
I offer this primarily because if it fulfills it will mean that we may have an extended wave 5.  The underlying condition of the market may be one of bear and sideline money capitulation and we may see undignified chasing of prices higher for a good period of time and a significant distance on the chart.  An running flat correction can and often will lead to a blowoff top to a wave 5 of 5.  The setup is there on the chart.  Will it complete? If it does, shorting the market should be banished from your mind until Wave 5 is complete and all the bullish impulse is exhausted.  That said, I think it is the less likely to fulfill of the two scenarios.  The five wave structure of the ending C wave is iffy and could need a few days of work.

Or the whole thing could just roll over and collapse into ruins.  I see no evidence of that, but heck, stuff happens.

Good luck and good trading!

Generally these reports as well as twice weekly video reports are prepared for BullBear Trading Service members and then released to the general public on a time delayed basis.  To get immediate access just become a member.  It's easy and currently free of charge.

Disclosure: No current positions.

By Steve Vincent

http://www.thebullbear.com

The BullBear is the social network for market traders and investors.  Here you will find a wide range of tools to discuss, debate, blog, post, chat and otherwise communicate with others who share your interest in the markets.

© 2010 Copyright Steven Vincent - All Rights Reserved Disclaimer: The above is a matter of opinion provided for general information purposes only and is not intended as investment advice. Information and analysis above are derived from sources and utilising methods believed to be reliable, but we cannot accept responsibility for any losses you may incur as a result of this analysis. Individuals should consult with their personal financial advisors.


© 2005-2022 http://www.MarketOracle.co.uk - The Market Oracle is a FREE Daily Financial Markets Analysis & Forecasting online publication.


Post Comment

Only logged in users are allowed to post comments. Register/ Log in