


U.S. Interest Rates and Treasury Bonds, World Funding Devastation
Interest-Rates / US Bonds Mar 31, 2010 - 01:55 PM GMTBy: Bob_Clark

 In their constant search for the "Crisis Du Jour," the investment community has swung their attention to a funding crisis in the U.S.A. This crisis fits a cyclical model that I watch in the bond market so I thought I would take a quick overview and see what it is saying about the next few months and the year in general.
The United Sates is not alone in this funding dilemma, Japan and Britain are in worse shape than America. The rest of Europe is not far behind with some countries dead on arrival. Any backup in funding which leads to higher rates will cripple the fragile economic recovery. It seems obvious that it can't be permitted to happen. The world runs on debt and the availability of cheap money created out of thin air. This is nothing new, it has been so for a long time. Is it different this time?
Let's see what the charts are saying.
The chart below is of yields on long term bonds as represented by the TYX index. The chart goes back to the seventies and gives a good historical view of rates as they swing from low to high.
I also put in the head and shoulders pattern that the bond bears point to as a sign of much higher rates to come. The head and shoulders pattern projects to a yield of six and one half percent.
Interest rates tend to be fairly cyclical, with a tendency to peak every three years. In the chart below I have marked those high points with an sienna dot. The first thing that jumps out, is that the trend to lower rates has been relentless. The second thing that we see is that after what looks like a blow off bottom, we seem to be heading for another three year peaking of rates. How high will rates go? Since nineteen eighty two we have never once exceeded a previous three year rate peak. Will the last three year high hold? Is the head and shoulders pattern valid?
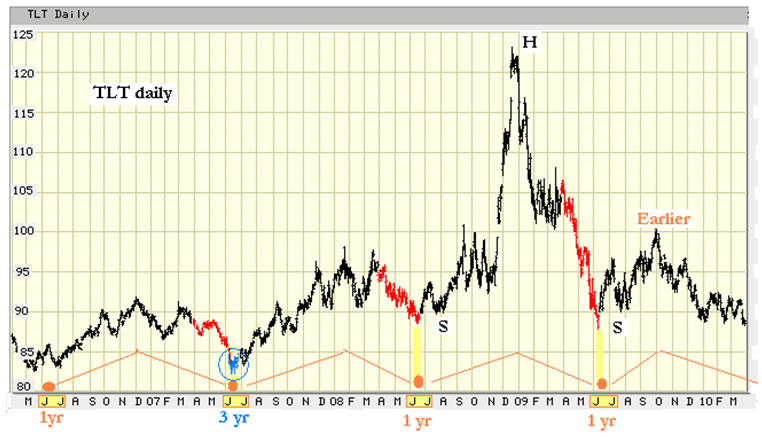
The lower chart shows the TLT which displays four years of daily trading in the long term bond ETF. Bond prices move inversely to their yields so when yields peak bond prices bottom.
As you can see we have made a low like clockwork every year in the June time frame and there is no reason to assume this year will vary much from that routine. I also put in the last three year low in blue. The red areas delineate what prices did in past cycles from the current time frame (end of March) into the June lows. The head and shoulders in the above chart is shown here as well.
As you can see we should see weaker bond prices for the next two months. We seem to have made the one year high at the beginning of October, that is earlier than normal which has bearish implications as it shows that the three year trend is heading down as well as the one year. Both cycles should bottom together in June. Whether we take out the last three year low remains to be seen. It seems very possible but rates in the six to seven percent range will stop the economy in it's tracks. Then the next cycle of falling rates and rising bond prices will begin.
To wrap up
So far it looks like a normal cyclical rate rising cycle which should be over in a few months and I for one will be not be over reacting to a funding panic. When an upcoming disaster is apparent to all, it seldom occurs as expected. When I trade, I always ask myself what is good for the Bankers.
The fact that we have never exceeded a previous three year interest rate cycle high in thirty years does not mean that this time it won't happen but with the amount of debt that has to be rolled over plus all the new funding necessary around the world, you can be sure that the Bankers are only going to let rates reach a level that bleeds the patient but does not kill. Plans are being made to avoid high rates. Quantitative easing is the only way to save the Bankers and let them continue to suck at the jugulars of the debt enslaved masses.
Never forget, the Fat Boys love a crisis and the one sided market it creates because they take the other side of the trades. Remember the US Dollar crisis a few short months ago when every hedge fund was short. How about the Armageddon in stocks that was suppose to begin in March of last year or even the next leg down expected in January. Where are those hedgies now? They are shorting the bonds. When the FB's take all their money again no one will care because rates will be falling again.
When it comes to Bankers and the Fat Boy's, they do what is best for themselves, so keep this rule in mind. They run the world and if you are not with them, you are a victim.
Bob Clark is a professional trader with over twenty years experience, he also provides real time online trading instruction, publishes a daily email trading advisory and maintains a web blog at www.winningtradingtactics.blogspot.com his email is linesbot@gmail.com.
© 2010 Copyright Bob Clark - All Rights Reserved
Disclaimer: The above is a matter of opinion provided for general information purposes only and is not intended as investment advice. Information and analysis above are derived from sources and utilising methods believed to be reliable, but we cannot accept responsibility for any losses you may incur as a result of this analysis. Individuals should consult with their personal financial advisors.
© 2005-2022 http://www.MarketOracle.co.uk - The Market Oracle is a FREE Daily Financial Markets Analysis & Forecasting online publication.