Should Investors Believe in the Stocks Bull Market?
Stock-Markets / Stock Markets 2010 Mar 29, 2010 - 05:59 AM GMTBy: Money_Morning
 Jon D. Markman writes: Bears have been scratching for a vulnerable spot in the bulls' narrative in the past few weeks, but have been coming up empty, as they logged a blistering March.
Sellers tried to sink the market back in February as the long-simmering Greek debt fiasco roared into the headlines, but that didn't work out so hot for them. And early last week they tried again by both highlighting new reports of discord between the European Monetary Union authorities and Greece, and by flogging the news of a Fitch Ratings Inc. downgrade of Portuguese debt.
At some point, portfolio managers outside of Europe may decide that they care about these matters but for now there has been what you might call a Gallic shrug. Tant pis, as the French say.

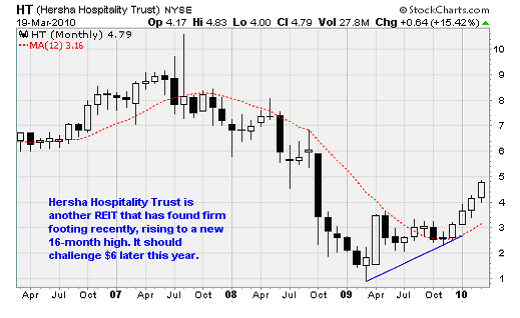
Notable new highs included another one of those impressive little REITs; this time it was Hersha Hospitality Trust (NYSE: HT), which zoomed 6% Friday after announcing it plans for a $100 million public offering of stock. In the old days, secondary offerings of stock like this would crush a stock; now it pushes them to new highs. It just goes to show you have to adjust your thinking all the time in this game.
.HT, which has been public for 12 years and pays a 4.5% dividend yield, is still 56% down from its 2007 high, but it's up 400% from its 2009 low. The company specializes in suite-style hotels in Northeastern central business districts and suburban office parks. It's the kind of company that can thrive again once business travel gets fully back on track.
Another notable new high was Wilshire State Bank (Nasdaq: WIBC), whose profile is very similar to many of the regional banks mentioned in the past few months. Based in Los Angeles, it focuses primarily on the Korean-American community in the Southwest by providing business and personal banking, trade finance, letters of credit, construction lending and home mortgages. It never fell quite as much as many other small banks based in Southern California, and has recovered a lot faster, with prices now right around its mid-2007 levels -- a rarity among financial stocks.
In short, the past ten days amounted to a mildly positive, non-volatile week that ended on a soft tone. During normal bull markets this is the sort of week that is very common. At the risk of jinxing it, maybe we're finally settling down to a more easy-going pace.

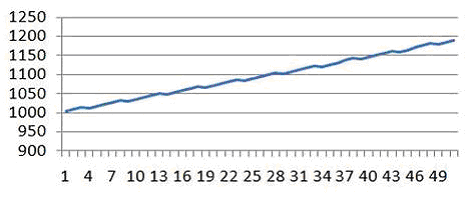
You might have forgotten what normal is like, so I did some simple math in a spreadsheet to give you a look at what an idealized year would look like. To create the perfect 52-week span above, I had the market advance 0.5% per week for three weeks, then suffer a 0.3% decline in the fourth week. I repeated that for 52 weeks, and the result was an average gain of 0.35% per week, or +19.56% for the year compounded.
What's valuable to note in this case is that 0.5% weeks would actually feel exceedingly dull. Consider that last week was a bit of a snoozer, and it actually ended with a 0.85% gain. So really what we would be after in an ideal market environment would be weeks on end that were even a little less exciting that last week most of the time, punctuated occasionally by consolidation weeks.
Since the past decade has been exceedingly volatile, maybe the market gods will shock us with a low-drama year in 2010. So far it's actually turning out that way. Stranger things have happened.
Primary Trend Remains Positive
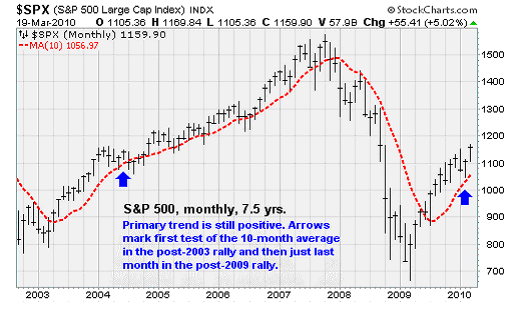
For long-term investors the best practice is to ignore the short-term gyrations so long as the primary trend is upward and intact. The glib way that we observe the primary trend is by observing whether the Standard & Poor's 500 Index is above its 10-month average at the end of a month. So long as it is, then we can say the trend is intact -- and actually a two-month dip beneath the 10-month average is required to definitively say the trend has changed for the worse, as it did in November/December 2007.

On Friday, our friends at Lowry's Reports in Florida provided a check-in with the primary trend on using their proprietary measurements. Their study shows no sign of an imminent major top, which is just about all we ever need to know about how to be positioned. Lowry's findings:
New Highs: The number of New NYSE 52-Week Highs has matched or exceeded the earlier peaks reached in late 2009 and early 2010. Historically, peaks in the number of new highs can occur a year or more prior to a major market top.
Advance-Decline Lines: The advance-decline lines for all the major price indexes are trading at new highs for the rally from the March 2009 market bottom. Typically, divergences between these adv-dec lines and their underlying price indexes occur at least four to six months prior to a major top.
Buying Power/Selling Pressure: Currently, Buying Power (demand) is in a well-established uptrend, while Selling Pressure (supply) is in an equally well-established downtrend. Historically, a sustained period of increasing supply, signaled by rising selling pressure, precedes major market tops. Obviously, no such uptrend currently exists.
Lowry's goes on to argue that if a modest topping process were to occur now, it would probably be mostly sequestered to the large-cap indexes. Because small-cap and mid-cap indexes have displayed a great deal of strength relative to large-caps this year -- probably due to less exposure to sales in weak areas of the developed world, like Europe and Japan -- they are the place to keep focused.
This has been my point of view too, with the added observation that insurance companies, retailers and regional banks are the industries with the least overseas exposure. So I suggest that you continue to focus most of your attention on these sectors and companies.
Overbought Short-term, Underbought Long-term
The Lowrys data is basically showing us that the big money is not quietly slipping out of the market on this advance, and any correction that ultimately takes place should be shallow and short-lived -- not the start of any long-term decline similar to October 2007.
The remarkable element in the recent advance is the fact that it has occurred in the face of many technical red flags. Virtually every oscillator designed to help us understand when stocks have gone too far, too fast is flashing a "stop" sign, and yet stocks keep barreling higher. This is pretty much a textbook definition of a "buying climax," as people who have been out of the market decide it's finally safe to pile in.
But what does it really mean when a stock or index is "overbought?" I can give you a glib answer ("too far too fast") or a long answer (the mathematical formulas for the RSI Index or Stochastics), but the truth is that it is one of those concepts that only matters when it matters. That is a roundabout way of saying that often it doesn't matter when everyone seems to think that it should. Often really fast-advancing markets will stay overbought for a long time, and really oversold markets will stay oversold for a long time -- which renders the concept meaningless.
Veteran market observer Justin Mamis says that at times like these, the rule is that "a decline will come only when unexpected, even to those who have been expecting it."

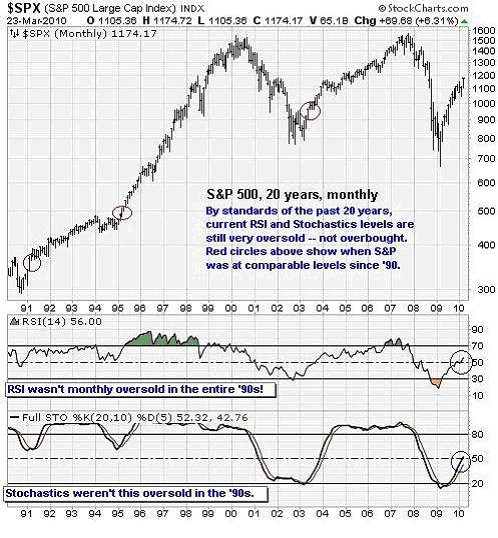
However there is one method of looking at overbought/oversold that does hold some merit, and that is on a really long-term basis. The chart above shows the S&P 500 Index over the past 20 years. You'll see that on a RSI and Full Stochastics basis, the benchmark index never got as oversold as it was last March during any year of those two decades -- or even close. And also you will notice that the index was extremely overbought on monthly basis from 1995-1999.
From a long-term perspective, we learn a couple things from this chart. One is that the decline in 2008-2009 was so incredibly deep and fast that it created an extreme-low condition that was not in the memory of most current market participants. It may not have been "different this time," but the last time it happened was so long ago that few remembered what it was like. So now the character and nature of the advance out of that extreme low is also outside the realm of most market participants' experience or memory.
If we take the chart at face value, then the major indexes are still very oversold and have a long, long, long way to go before they are as overbought as they were in 1992 or 2004 at the start of major up moves, much less in 1998 or 2006 in the middle of such a move.
And also the chart shows us that if you felt prudish about the overbought character of the market when RSI rose above 70 in 1995, you missed the next 1,000 point advance in the S&P 500.
My main feeling about these kinds of charts is that they are most helpful in the transition period from one extreme to the other, and that they help show the boundaries of mean reversion. That means a) Rising up out of oversold is a good time to be long and sinking down out of overbought is a good time to be neutral or short; and b) Extreme lows should be balanced out by extreme highs.
Right now this chart suggests that we should feel OK about being long for the next three or four years at least, and that if the next overbought period is anything like ones in the past, the terminal high of this cycle could be, don't laugh, around the 3,000 level of the S&P 500 -- or 32,000 for the Dow Jones Industrial Average.
Week in Review
Monday: No major economic releases. A batch of U.S. Treasury auctions started what would be a difficult week for the government debt market. The yield on seven-year Treasury notes jumped from just 3% earlier in the month to a high of 3.4% this week. Why? Investors are starting to price in the withdrawal of the Federal Reserve's buying power from the long-term debt market when it ends its quantitative easing or "QE" program that had the central bank purchase some $1.7 trillion worth of mortgage securities and government debt.
Tuesday: Existing home sales for February came in a hair over expectations, but remain extremely weak at an annual rate of 5.02 million. More worrisome: The build in supply, to 8.6 months of sales from 7.2 months in December, it the steepest rise in the last 20 years. This excess supply continues to weigh on prices.
Wednesday: New home sales also remain weak at a seasonally adjusted annual rate of just 308k, down 2.2% from the previous month. Supply jumped to 9.2 months. One bright point has been that mortgage applications for home purchases have increased in three of the last four weeks -- a possible indication of a bottom for housing activity. Another sign of hope is the recent increase in lumber futures prices, which tends to have a statistical correlation to home sales activity.
Thursday: Initial weekly jobless claimed dropped to a less-than-expected 442k for the week of March 20. Except for a single week in February, this is the lowest weekly jobless number for the recovery thus far.
Friday: Fourth quarter gross domestic product (GDP) numbers were revised down slightly to 5.6% from the previous estimate of 5.9%. Separately, the government reported that corporate profits surged an impressive 51.8% in the fourth quarter -- the best year-over-year change since the 2003-2004 recovery. Although recessions are painful events, they serve a necessary role of clearing out mal-investment, trimming unproductive assets and workers, and boosting profitability ahead of the next phase of economic growth. That's happening now, and it's a great sign of strength.
The Week Ahead
Monday: A report on personal income is likely to show a marginal 0.1% increase in January.
Tuesday: The January numbers from the Case-Shiller Home Price Index will be released. We'll also get a report on consumer confidence for the month of March.
Wednesday: A report on February factory orders and the latest Chicago Business Barometer will be released.
Thursday: Motor vehicle sales, the ISM Manufacturing Index, and initial weekly jobless claims come out today.
Friday: An important day with the release of the March payroll report, but the stock market will be closed for Good Friday. Analysts expect the first positive payroll number since 2007 to be a big one with a gain of 200k jobs. The unemployment rate is expected to remain unchanged at 9.7%.
Source: http://moneymorning.com/2010/03/29/bull-market-move/
Money Morning/The Money Map Report
©2010 Monument Street Publishing. All Rights Reserved. Protected by copyright laws of the United States and international treaties. Any reproduction, copying, or redistribution (electronic or otherwise, including on the world wide web), of content from this website, in whole or in part, is strictly prohibited without the express written permission of Monument Street Publishing. 105 West Monument Street, Baltimore MD 21201, Email: customerservice@moneymorning.com
Disclaimer: Nothing published by Money Morning should be considered personalized investment advice. Although our employees may answer your general customer service questions, they are not licensed under securities laws to address your particular investment situation. No communication by our employees to you should be deemed as personalized investent advice. We expressly forbid our writers from having a financial interest in any security recommended to our readers. All of our employees and agents must wait 24 hours after on-line publication, or 72 hours after the mailing of printed-only publication prior to following an initial recommendation. Any investments recommended by Money Morning should be made only after consulting with your investment advisor and only after reviewing the prospectus or financial statements of the company.
Money Morning Archive |
© 2005-2022 http://www.MarketOracle.co.uk - The Market Oracle is a FREE Daily Financial Markets Analysis & Forecasting online publication.


