Gold's Performance Relative to The U.S. Dollar Provides Us with Invaluable Insight
Commodities / Gold and Silver 2010 Mar 26, 2010 - 06:46 PM GMT In our previous commentary we analyzed the situation on the USD Index and since we have just seen it moving sharply higher, we believe you would appreciate an update. Once we cover the situation on the U.S. Dollar market, we will move to the implications it may have on the precious metals sector.
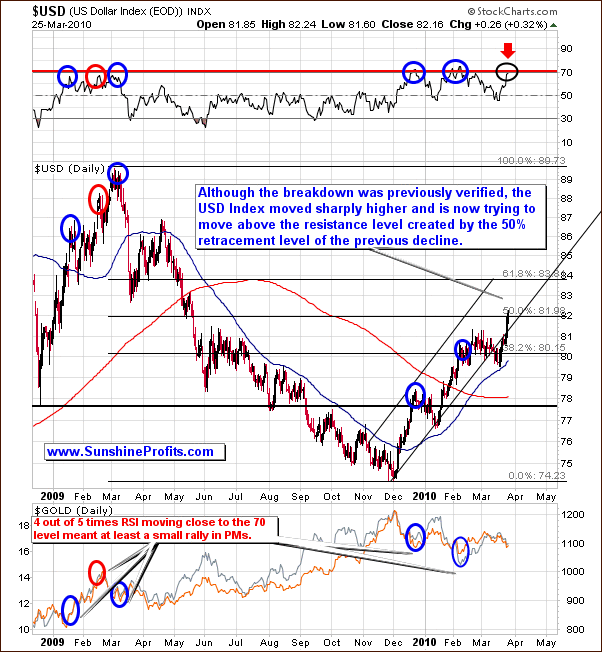
Moving on to the technical part of this week's update Let's begin with the long-term chart (charts courtesy by http://stockcharts.com)

In the previous essay we mentioned that we saw the USD index break below the up trending channel line. This move was confirmed with 3 consecutive closes below the lower channel trend line, so the next significant move in the index is likely to be down.
Well, by definition from time to time unlikely has to occur, and this is what we've seen this week, as the USD index rallied dramatically higher. This week the USD index pierced the lower border of the previous trading channel and once again moved inside of it. However, there is still a lot of evidence that this rally is not going to last because the latest upswing is knocking up against resistance at the Fibonacci 50 percent retracement level of the previous (2009 Mar - Dec) decline. Key Fibonacci levels have historically been reliable in identifying key support and resistance, especially on the U.S. Dollar market.
In addition, the Relative Strength Index (RSI) is right at the 70 level and looking at when this was the case in the past 4 out of 5 times at least a small rally took place in the precious metals market. Therefore, the long-term USD Index chart suggests higher PM prices. Let's take a look at the short-term chart for more detailed view.

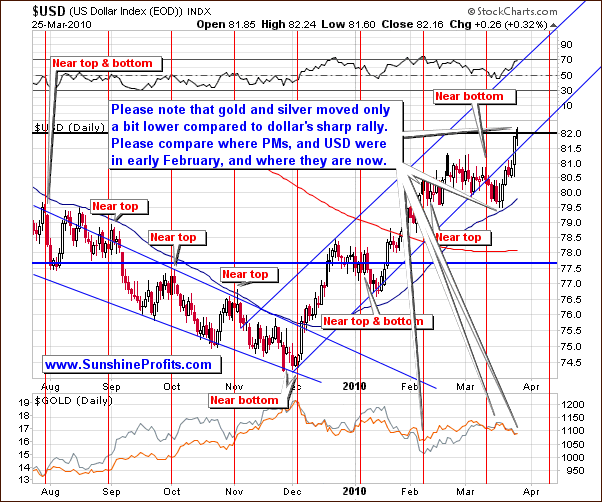
What is even more visible on the short-term chart than it was the case with the long-term one is the way PMs reacted to the recent strength in the U.S. Dollar. Please note that even though the USD index had a significant rally, Gold and Silver were basically unharmed as they moved down just slightly. We realize that the very recent downswing in PMs might have appeared dramatic on a day-to-day basis; it is much less so when one takes compares it to the analogous move in the U.S. Dollar. This certainly bodes well for the possibility of higher prices in the precious metals going forward.
Therefore, despite this week’s price appreciation in the USD Index, we are still not bullish on this market. Given the historical significance of the RSI being at 70 and the fact that the USD Index has just touched the 50% retracement of the previous rally leads us to anticipate that the recent USD Index rally will stall out and retrace. In addition, a rally for PMs and PM stocks is looking more and more probable.
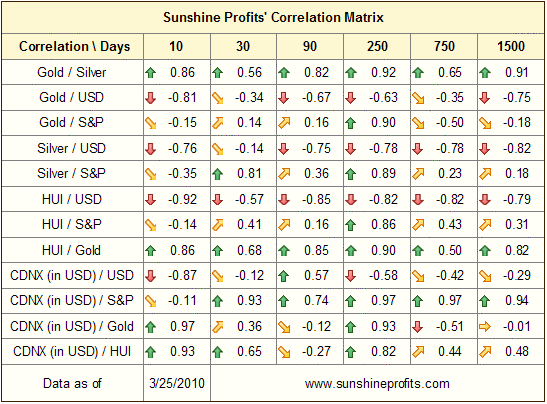
Additional details regarding the correlation between the USD Index and the precious metals can be found in our correlation matrix.

The main thing to notice on the correlation matrix this week is how we are starting to return to the highly negative correlation between the U.S. Dollar and the precious metals. Look over the last 10 trading days how that the Gold/USD, Silver/USD and HUI/USD are all starting to increasingly get more negative.
Additionally, please take a look at the 30-day column and the values of correlation coefficients between Gold and USD Index / S&P 500. What is particularly interesting is the fact that for the first time since many weeks the correlation between gold and USD Index is stronger than with the general stock market. Moreover, that is also the case with the HUI Index.
When we commented on the correlation matrix in the last week's Premium Update - we wrote the following:
These values are nothing to call home about per se, but once you compare them with the values from the previous week we see that they have all declined, suggesting that perhaps we won't have to wait too long for the return of the strong negative correlation between PMs and the USD Index.
This week, we see stronger evidence of the return of the negative correlation between gold and USD Index, which (as mentioned two weeks ago) is one of the things that would indicate that the PM market is ready to move higher.
Summing up, the USD Index moved to its resistance level after having rallied strongly. This rally caused gold to move lower, but its decline was relatively small. This is bullish for PMs in two ways. Firstly, it means that gold is once again becoming negatively correlated with the USD Index, which in the past meant that PMs are ready to move higher. Secondly, it suggests that the gold market is strong, as it has held up relatively well. Should anything change we will send out a Market Alert to our Subscribers ASAP.
To make sure that you are notified once the new features are implemented, and get immediate access to my free thoughts on the market, including information not available publicly, I urge you to sign up for my free e-mail list. Sign up today and you'll also get free, 7-day access to the Premium Sections on my website, including valuable tools and charts dedicated to serious PM Investors and Speculators. It's free and you may unsubscribe at any time.
Thank you for reading. Have a great and profitable week!
P. Radomski
Editor
Sunshine Profits
Interested in increasing your profits in the PM sector? Want to know which stocks to buy? Would you like to improve your risk/reward ratio?
Sunshine Profits provides professional support for precious metals Investors and Traders.
Apart from weekly Premium Updates and quick Market Alerts, members of the Sunshine Profits’ Premium Service gain access to Charts, Tools and Key Principles sections. Click the following link to find out how many benefits this means to you. Naturally, you may browse the sample version and easily sing-up for a free trial to see if the Premium Service meets your expectations.
All essays, research and information found above represent analyses and opinions of Mr. Radomski and Sunshine Profits' associates only. As such, it may prove wrong and be a subject to change without notice. Opinions and analyses were based on data available to authors of respective essays at the time of writing. Although the information provided above is based on careful research and sources that are believed to be accurate, Mr. Radomski and his associates do not guarantee the accuracy or thoroughness of the data or information reported. The opinions published above belong to Mr. Radomski or respective associates and are neither an offer nor a recommendation to purchase or sell securities. Mr. Radomski is not a Registered Securities Advisor. Mr. Radomski does not recommend services, products, business or investment in any company mentioned in any of his essays or reports. Materials published above have been prepared for your private use and their sole purpose is to educate readers about various investments.
By reading Mr. Radomski's essays or reports you fully agree that he will not be held responsible or liable for any decisions you make regarding any information provided in these essays or reports. Investing, trading and speculation in any financial markets may involve high risk of loss. We strongly advise that you consult a certified investment advisor and we encourage you to do your own research before making any investment decision. Mr. Radomski, Sunshine Profits' employees and affiliates as well as members of their families may have a short or long position in any securities, including those mentioned in any of the reports or essays, and may make additional purchases and/or sales of those securities without notice.
Przemyslaw Radomski Archive |
© 2005-2022 http://www.MarketOracle.co.uk - The Market Oracle is a FREE Daily Financial Markets Analysis & Forecasting online publication.
Comments
|
RAJ
27 Mar 10, 02:36 |
Good Work
I like your report but need analysis on Volume and Technical |


