


The Dow Marches On as Gold Investors Increasingly Throwing in The Towel
Stock-Markets / Financial Markets 2010 Mar 26, 2010 - 03:13 AM GMTBy: Steve_Betts

 “Fighting for peace is like screwing for virginity!” - George Carlin
We continue to hear all sorts of optimistic comments about the recovery in the US, and the media tends to gloss over any less than optimistic statistics. There is always an excuse! In order to justify the discrepancies we invent new slogans like the “jobless recovery” in order to validate rising unemployment in a supposedly improving economic environment. Given today’s rather pessimistic housing numbers, you might want to call this the homeless recovery as well.
Many people had been pointing to rising lumber prices as a sign that the housing sector was on the mend, but I contend that natural disasters such as the earthquakes in Haiti and Chile have a lot more to do with rising lumber prices than the US housing market. For those of you who thought the housing market had bottomed, you might want to think again. New home sales were at a seasonally adjusted rate of 308,000 and that is a record low. This first chart shows monthly new home sales (not seasonally adjusted), and if you look at the
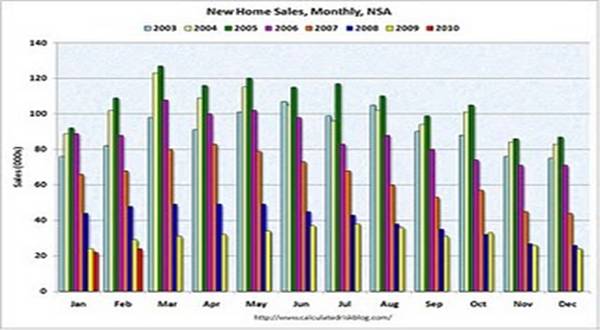
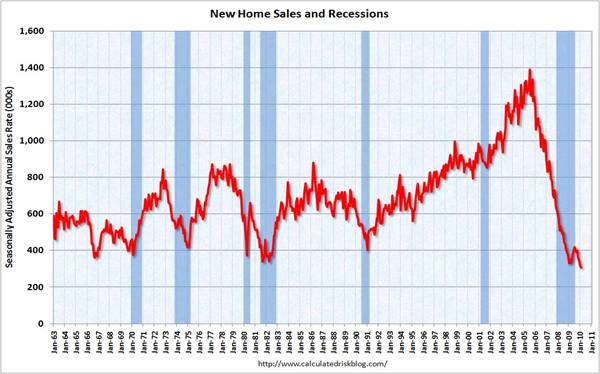
red columns for 2010 you’ll see that February sales were 24,000. This is below the previous record low of 29,000 hit three times: in February 2009, 1982, and in 1970. This second chart shows new home sales versus the recession for the last 45 years, and you can see the huge drop followed by a slight increase in January and then the February new all-time low:
Finally this wouldn’t be so bad if we saw declines in inventory but as you’ll see below, inventories in February rose to a 9.2 month supply:
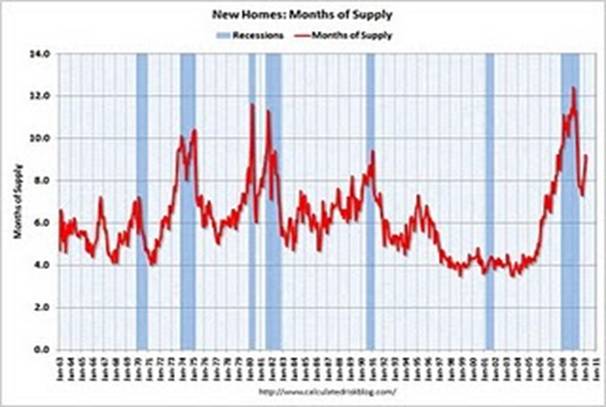
The seasonally adjusted estimate of new houses for sale at the end of February reached 236,000 and does not include areas with many new condos or the number would be a lot higher.
Every day we have a new wrinkle in the market and the latest is the upside breakout in the US dollar. Since most of the debt around the world is in US dollars, and most commodities are prices in US dollars, this raises the cost of living and doing business for most of the world. Aside from that many folks placed large bets that the dollar would decline over the short run, and they are all getting their clocks cleaned. Yesterday we saw the June US Dollar Index futures contract stage a huge rally, closing out the session at 82.11 and well above what had been strong resistance at 81.32. Early this morning the June contract tried to sell off, falling as low as 81.89, but is now back up into positive territory at 82.14. There is no real resistance until the greenback hits 82.42 and strong resistance is all the way up at 83.35. Take a look:
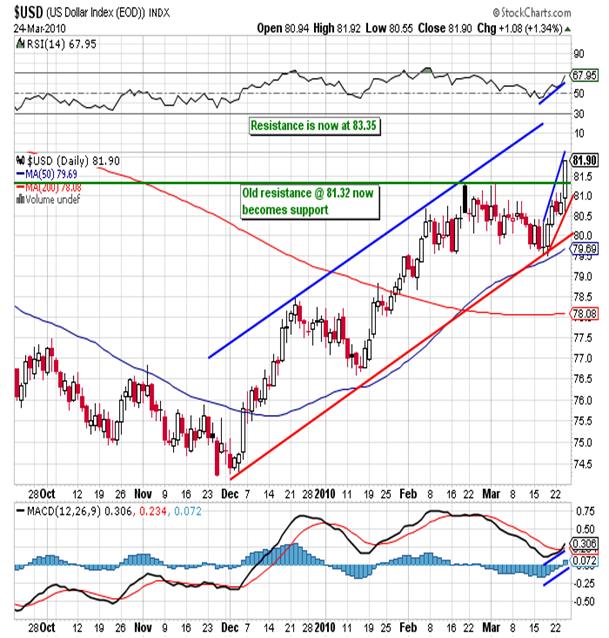
Even though the dollar is approaching the overbought area, this is a strong looking chart as the histogram has just popped up into positive territory. On the other hand neither RSI nor MACD confirmed the recent new closing high, as was the case with previous significant highs in the dollar. Like almost every market in today’s world, we just don’t get a clear picture.
The one market that isn’t pulling any punches though is the Dow. As I type the Dow is up 110 points 10,957 and just doesn’t want to back off. Take a look at the following daily chart and you’ll see what I mean:
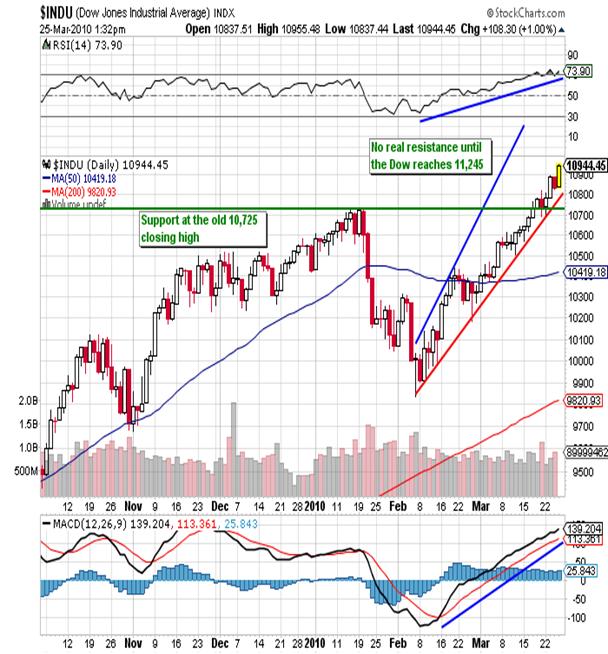
The move is approaching vertical and leaves little room for error as the RSI is almost at 75, an extremely overbought reading. It also resembles a classic blow-off phase. For those of you who bought the Dow when the buy signal was given last week, I would seriously consider taking profits here. The Dow has no real resistance until it reaches 11,245 and could possibly get there without a reaction, but there is risk. The support will come in at the old closing high of 10,725 and then again down at 10,526. Assuming we do see some sort of reaction, I would expect the 10,526 level to hold.
Finally I want to say a quick word or two about gold before I close. Yesterday we saw price break and close below the 1,090.10 support, and after a brief attempt to move back above it this morning, the yellow metal is trading almost unchanged at 1,088.20. I am looking for a run down to strong support at 1,077.60 and maybe even as low as 1,048.90 as gold continues the consolidation it began back in December. There’s nothing wrong with this as we’ve seen it before:
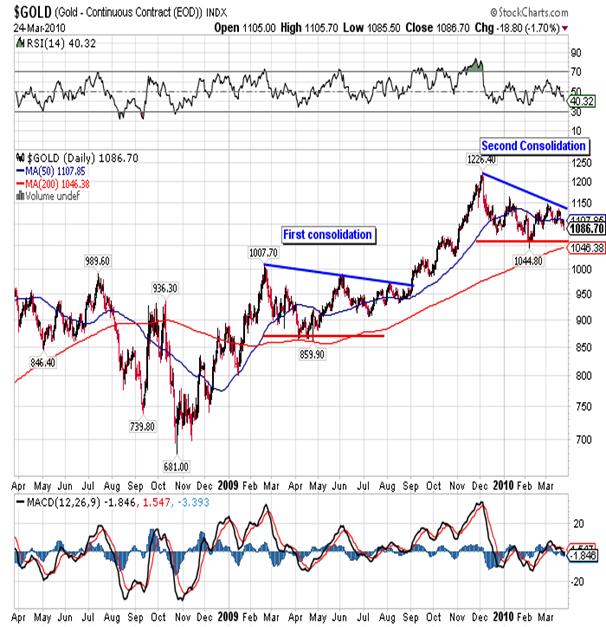
History usually repeats itself and that also holds true for the gold market. More and more investors throw in the towel with each passing session and yet the charts tell us nothing is wrong. Those who bail out here are just giving their gold away.
By Steve Betts
E-mail: team@thestockmarketbarometer.com
Web site: www.thestockmarketbarometer.com
The Stock Market Barometer: Properly Applied Information Is Power
Through the utilization of our service you'll begin to grasp that the market is a forward looking instrument. You'll cease to be a prisoner of the past and you'll stop looking to the financial news networks for answers that aren't there. The end result is an improvement in your trading account. Subscribers will enjoy forward looking Daily Reports that are not fixated on yesterday's news, complete with daily, weekly, and monthly charts. In addition, you'll have a password that allows access to historical information that is updated daily. Read a sample of our work, subscribe, and your service will begin the very next day
© 2010 Copyright The Stock Market Barometer- All Rights Reserved
Disclaimer: The above is a matter of opinion provided for general information purposes only and is not intended as investment advice. Information and analysis above are derived from sources and utilising methods believed to be reliable, but we cannot accept responsibility for any losses you may incur as a result of this analysis. Individuals should consult with their personal financial advisors.
© 2005-2022 http://www.MarketOracle.co.uk - The Market Oracle is a FREE Daily Financial Markets Analysis & Forecasting online publication.