


The U.S. Dollar Rules
Currencies / US Dollar Mar 24, 2010 - 07:13 PM GMTBy: Steve_Betts

 Life is like a box of chocolates. You never know what you’re going to get! - Forrest Gump
Today is a continuation of yesterday in the sense that we are seeing some markets breakout and define their new directions. Yesterday the Dow posted a triple digit gain and closed well above what should have been strong resistance at 10,817, and early this morning we saw the US dollar rocket thru what had been strong resistance at 81.32. Right now the June US dollar futures contract is trading up .92 at 82.03, and although I can’t be sure where it will close, I feel fairly confident in saying that it will close above 81.32. The significance of this move is important and implies a lot more than the fact that the dollar is currently “strong”.
This move means that the deflationary pressure that I thought was ebbing is still present, and it may even be increasing. That’s really bad news for a Fed that has chosen the path to “inflate or die”. The one thing you cannot imply from this is that there is a new bull market for the dollar. The dollar is still being printed en mass and sooner or later it will turn down, just not today.
In the following two-year daily chart of the US Dollar Index we don´t have today’s price action, but it’s easy to see that it has broken out to the upside:
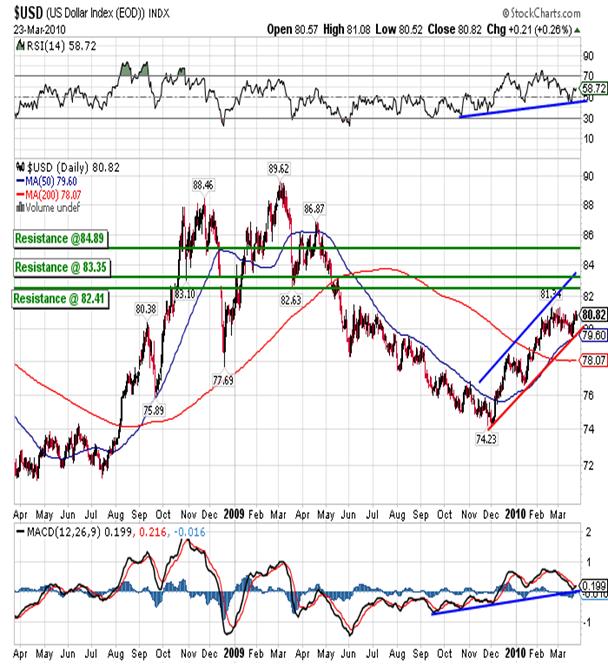
With today’s rally the histogram will almost surely move into positive territory and that is a positive signal. From here the dollar will run into good resistance at 82.41, 83.35, and then again at 84.89. My bet for a top is 83.35. Good support remains down at 79.62. Right now we are miles above that as the chart shows the secondary trend clearly moving higher while RSI and MACD trace out a series of higher lows. The dollar is still a long way from being overbought right now so it should easily reach 83.35 and could possibly move to 84.89 before the tank runs dry.
Gold is headed in the opposite direction as the April gold futures contract closed below strong support at 1,090.10 today. Although the price hasn’t settled yet, it looks like the April contract will close around 1,088.50 meaning that we now have a lower low. This is more evidence of the exis-
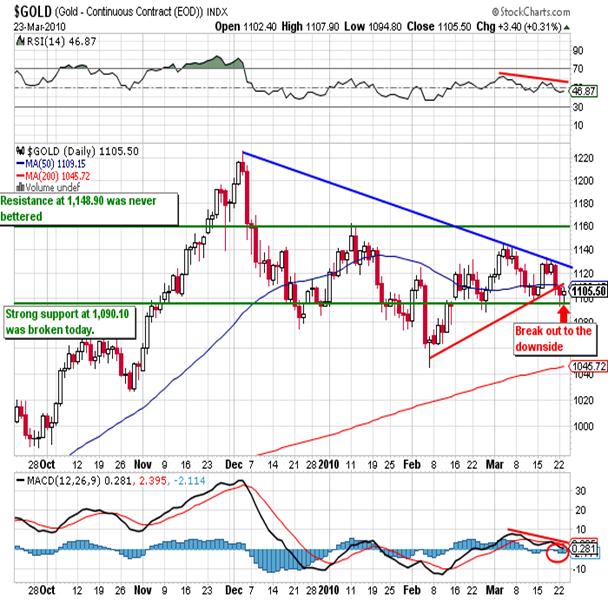
tence of deflationary pressure. Note how the RSI and MACD are now headed down and the histogram has fallen into negative territory (red circle). Today’s price movement is not on this chart but if it were the break down, it would seem much more dramatic. This now brings into play a test of strong support at 1,048.70 and maybe even critical support at 999.40. Since gold is nowhere near oversold, it can easily make it to 1,048.70.
Now I want to talk some more about deflation and I want to use the following ten-year weekly chart of copper as an example:
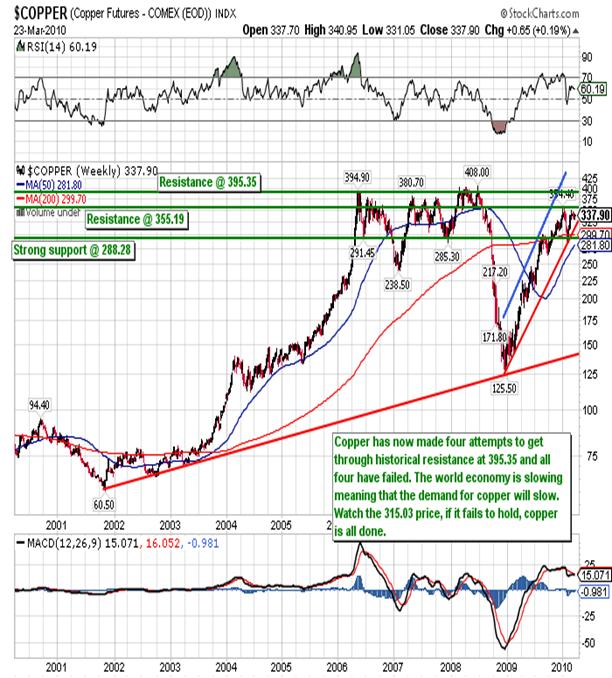
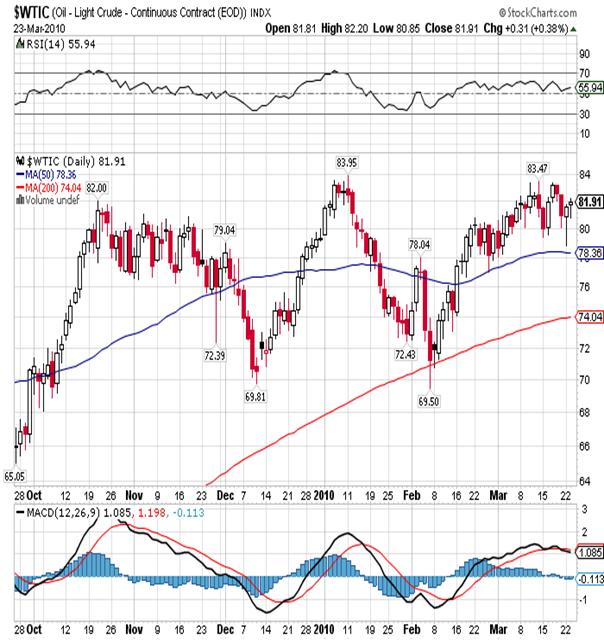
Copper is extremely important as it is used in about sixty percent of everything we come into contact with on a daily bases. You can see in this chart that copper made three solid attempts to move through strong resistance at 395.35 and they all failed These were followed by a brutal sell-off and a rally back up to resistance at 355.19. From there copper has fallen to its current price at 333.20 and is approaching a critical test of support at 315.03. Should this support fail it will be followed by a test of 288.28 support, and then a complete breakdown. The real question is if the US economy is on the mend, how come copper prices are down for the year? Better yet how come oil has gone nowhere for almost six months?
I know the Fed is praying for inflation and everyone is trying to talk the economy up, but we just saw housing decline for the third consecutive month. We can then look at China, salesman to the world, and we see that its own stock market continues to look like its rolling over:
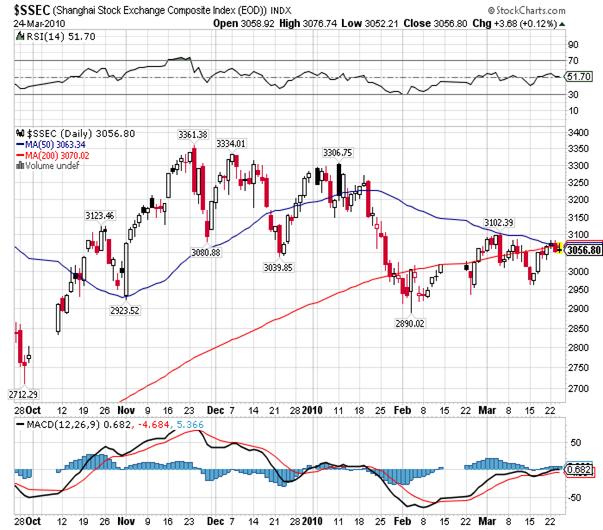
Strange behavior assuming that everything is supposedly getting better! The only thing in favor of the optimists is the stock market in the US, and I’m the first to admit that it’s no small item either. Yesterday the Dow closed well above strong resistance at 10,817 and today, after trying to sell off in the morning, is about to close down 50 points. The Dow remains extremely overbought but every attempt to sell it finds buyers. That’s due to huge amounts of liquidity controlled by several very large players; free government money designed to support the market. Once confidence in that fiat money begins to erode, and it will, the market will collapse of its own accord. Until then, we wait.
By Steve Betts
E-mail: team@thestockmarketbarometer.com
Web site: www.thestockmarketbarometer.com
The Stock Market Barometer: Properly Applied Information Is Power
Through the utilization of our service you'll begin to grasp that the market is a forward looking instrument. You'll cease to be a prisoner of the past and you'll stop looking to the financial news networks for answers that aren't there. The end result is an improvement in your trading account. Subscribers will enjoy forward looking Daily Reports that are not fixated on yesterday's news, complete with daily, weekly, and monthly charts. In addition, you'll have a password that allows access to historical information that is updated daily. Read a sample of our work, subscribe, and your service will begin the very next day
© 2010 Copyright The Stock Market Barometer- All Rights Reserved
Disclaimer: The above is a matter of opinion provided for general information purposes only and is not intended as investment advice. Information and analysis above are derived from sources and utilising methods believed to be reliable, but we cannot accept responsibility for any losses you may incur as a result of this analysis. Individuals should consult with their personal financial advisors.
© 2005-2022 http://www.MarketOracle.co.uk - The Market Oracle is a FREE Daily Financial Markets Analysis & Forecasting online publication.