The Stocks Bull Bear Market Report
Stock-Markets / Stock Markets 2010 Mar 24, 2010 - 05:08 AM GMTBy: Steven_Vincent
 BullBear traders have been long US equities (with the exception of a brief 2 day interlude) since the February 5th bottom. We continue to hold our long positions with an eye towards a mid-April top.
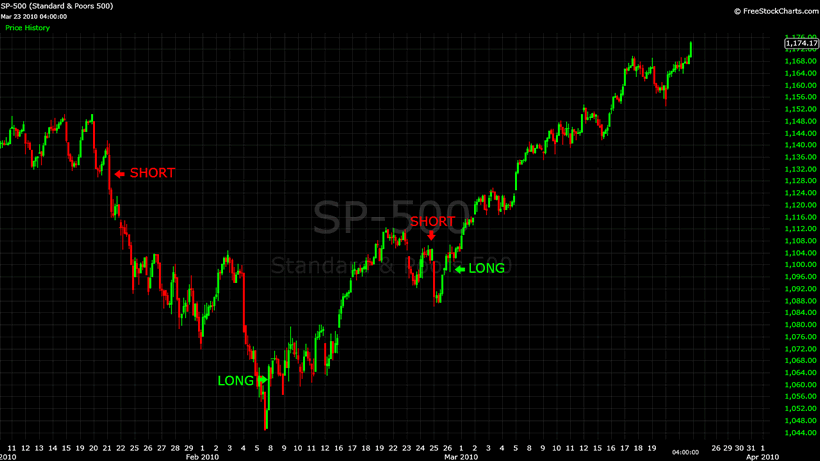
The SPX appears to be about half way through completing Wave 5 of the first wave of a bull market.
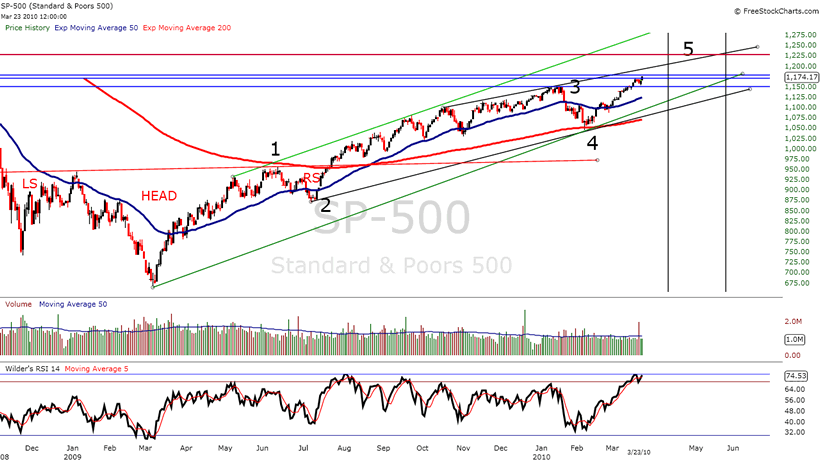
Wave 5 appears to be nearing the completion of its wave 3. The ensuing wave 4 A-B-C correction seems likely to set up the final wave 5 of 5 to a mid-April top in the 1228-1244 zone. The 1228 is exactly the 61.8 Fibonacci retracement level of the bear move from the all time high in 2007 as well as the 23.6 Fibonacci retracement level of the bull market from the 1982 bottom. There is also horizontal price congestion from 1999, 2001, 2005, 2006 and 2008 at that level. The 1244 level is the target given by the reverse head and shoulders bottom that began formation in November of 2008. By that time and price full bear capitulation will have taken place and breadth and sentiment indicators should be quite overbought on all time frames, setting up the most significant decline in time and price yet seen since the bottom in March of 2009. Based on the wave structure and available supporting evidence at this time, such a decline will likely be a corrective A-B-C Wave 2 rather than a resumption of the prior bear trend.
Should SPX finish the month above current levels, it will have successfully closed above two key long term moving averages--the 50 month EMA and the 160 month SMA--which were previously key support during the prior bull trend.
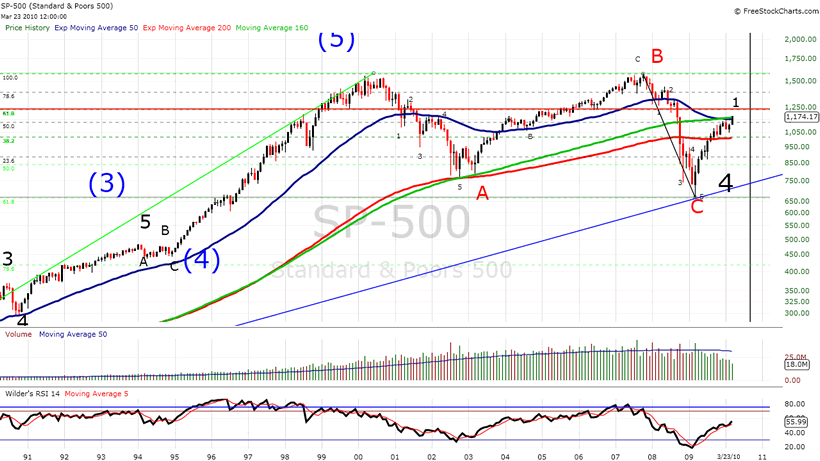
On a very long term basis, an argument can now be made that SPX is now in Wave 1 of Wave 5 in the primary bull market that began after the better than 90% retracement that ended in 1932. In this schema the lateral bear market from 2000-2009 was a Wave 4 A-B-C corrective wave similar to the lateral corrective Wave 2 from 1966-1974. The bull market that ended in 1929 marked the end of the Industrial Revolution wave in financial assets. We are then currently beginning the terminus wave of the Financialist Fiat regime that began with the founding of the Federal Reserve system in 1913 and the subsequent adoption of Keynsian economics and socialist government. This wave may possibly be marked by a pure asset bubble without any fundamental underpinnings whatsoever and may be very large as well as short in time but followed by a resoultion similar to the post-1929 scenario. The dénouement of this epochal terminus would then resolve into the age of World Government and Global Economic Management. This is a working thesis and there are other interpretations of wave counts as well as socio-economic development.
With regards to much more near term developments, much ado has been made about the sentiment picture, particularly with regards to put/call data. Let's have an in depth look at the Equity, Index and Total put/call ratio data. Here we are working with a 21 day SMA with a line price on close.
The Equity put/call data is generally regarded as a measure of sentiment of the "dumb money"--speculators who are generally wrong on the market. When they are buying calls heavily in a bull trend it is a contrarian signal that a top is near and vice versa.
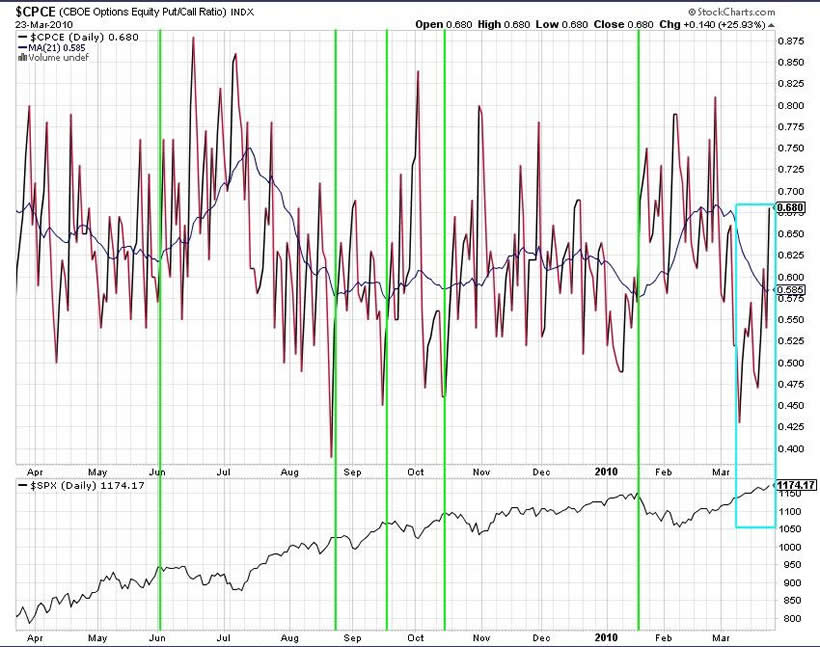
First, let's take this rally off the February bottom as an analog for the rally from the July bottom. Both followed A-B-C corrective waves which were similar in size and time. We can note that the moving average has declined to a level close to its reading at the August top after the July bottom. Yet the decline following that reading was short and shallow and failed to produce the fear that would drive equity options players to purchase puts. Thus, the rally continued while the readings bumped along the bottom. Today we can see (blue box) that since March 8th equity players have been buying puts into the rally in a series of rising price lows peaking at very high levels on a bullish breakout day today. This is hardly a picture of the complacency associated with significant tops in sentiment and price. There seems to be a drive to pick a top here rather than throw into the rally.
The Index put/call data is generally regarded as an indicator the "Smart(er) Money"--professional portfolio and money managers who typically use index puts to hedge their long exposure.
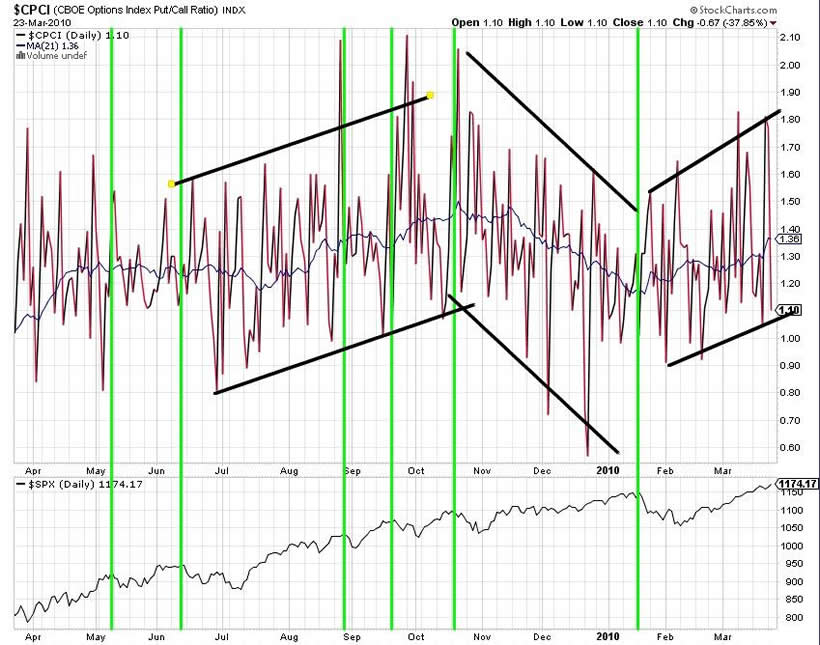
We can see three distinct trends in the data since July. During the July-October rally these professionals bought index puts to hedge their growing long positions as the rally proceeded. There was still much doubt about the durability of the advance and the smart money hedged. From mid-October to January we see increased complacency as these players decreased their hedging activity and showed some complacency with the rally. This may have been a factor in producing the January top. Since the January top we can see that index options players are once again hedging risk as the rally proceeds higher in the current wave 5, repeating the behavior seen in the wave 3 advance (and thus helping to confirm the validity of the wave structure).
The Total put/call ratio combines equity and index options.
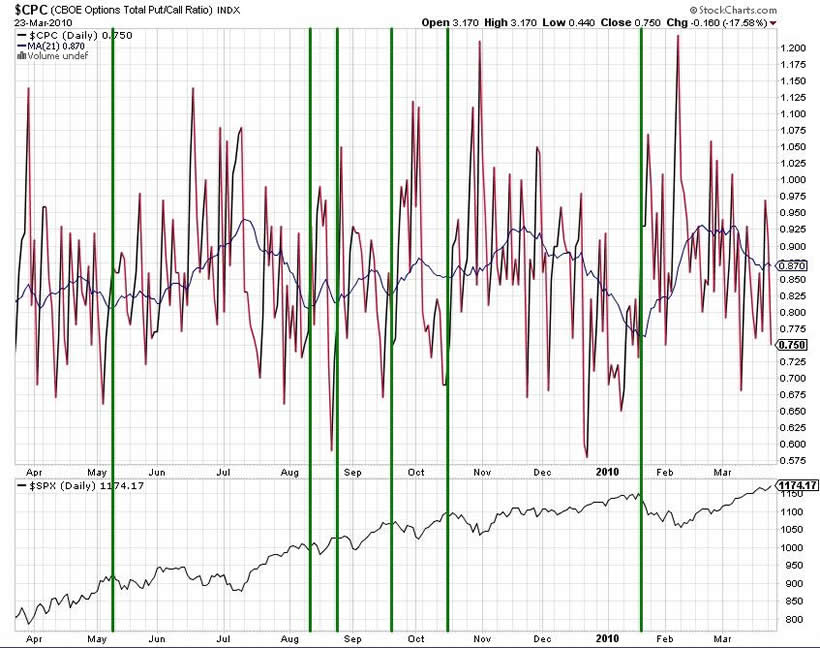
This chart has thusfar been more clearly predictive of tops and bottoms than the other two. We can see that it is far from levels seen at the August and January tops. My overall take is that while there may be enough bullishness in sentiment for a corrective wave 4 pullback to channel support at about 1150 on SPX, there is not yet the basis for calling a significant top. Certainly, there are breadth indicators not covered here which are showing significantly overbought readings. But in a strong bull trend, particularly one characterized by progressive bear capitulation ( vis Peter Schiff, Charles Biderman) and sideline money anxiety over "missing it", overbought can become more overbought for a while.
For the reasons cited above and many more not covered here, BullBear traders are looking for a mid-late April top in the 1228-1244 area with a minor wave 4 corrective decline to support after acheiving the reverse head and shoulders target of 1178-1180 (with a possible extension to whole number resistance at 1200).
For a more complete analysis including coverage of stock sectors, the precious metals, crude oil, forex and technical indicators watch the BullBear Weekend Report:
Generally these reports as well as twice weekly video reports are prepared for BullBear Trading Service members and then released to the general public on a time delayed basis. To get immediate access just become a member. It's easy and currently free of charge.
Good luck and good trading!
Disclosure: No current positions.
By Steve Vincent
The BullBear is the social network for market traders and investors. Here you will find a wide range of tools to discuss, debate, blog, post, chat and otherwise communicate with others who share your interest in the markets.
© 2010 Copyright Steven Vincent - All Rights Reserved Disclaimer: The above is a matter of opinion provided for general information purposes only and is not intended as investment advice. Information and analysis above are derived from sources and utilising methods believed to be reliable, but we cannot accept responsibility for any losses you may incur as a result of this analysis. Individuals should consult with their personal financial advisors.
© 2005-2022 http://www.MarketOracle.co.uk - The Market Oracle is a FREE Daily Financial Markets Analysis & Forecasting online publication.


