Three Reasons U.S. Housing Market Will Head Lower
Housing-Market / US Housing Mar 22, 2010 - 01:28 PM GMTBy: Q1_Publishing
 It’s one of the most pressing questions facing investors today.
Is the housing market about to recover?
With the housing market at the center of the credit crunch, any recovery in the housing market could quickly turn the Wall Street recovery into a Main Street recovery.
Consumers would start shopping again. Employment would rebound. And stocks would likely make the next move higher.
But we’re coming out of a genuine bubble decades in the making. And decades of overinvestment creating oversupply are rarely worked off in a couple of years.
That’s why the when you look at the true fundamentals of the housing market you can get a much better idea of when the market will recover, where prices are headed, and what it all means for the markets in the short and long term.
Back to Basics
In his annual letter to Berkshire Hathaway (BRK-A/B:NYSE), Warren Buffett said the light at the end of the housing tunnel isn’t far off:
Within a year or so, residential housing problems should largely be behind us. Prices will remain far below 'bubble' levels, of course, but for every seller or lender hurt by this there will be a buyer who benefits.
His rationale, in typical Buffett-like fashion, cut through all the weekly noise and focused on what mattered – supply and demand.
The world’s greatest investor noted that during the bubble years there were two million homes being built per year. He added that households were only being created at a rate of 1.2 million per year.
Supply was far outpacing demand and it couldn’t go on forever.
And it didn’t.
Long-time readers would naturally wonder, has Warren Buffett been reading the Prosperity Dispatch?
Five months ago the housing was still just showing its initial signs of recovery. The “temporary” tax credit for buying homes was about to expire and most expected the rebound in housing to be short-lived.
Our research, thanks in part to an extended lunch with some timber industry insiders, showed the herd was about to be proven wrong again.
We wrote:
Over the long run the outlook for housing is much different than it is now. It’s all because the fundamental driver of housing demand is population growth.
The Population Reference Bureau expects the population to grow at 0.9% per year through 2050. If we extrapolate the results of recent
Texas A&M University study, Housing Market Mirrors Population Growth, which correlates housing and population growth excluding the recent bubble years, the 0.9% population growth means housing demand will increase 1.12% per year.
That means 1.26 million new homes (105 million currently + 1.12% per year growth) will need to be built each year.
The current new housing construction rate is 660,000 per year.
During the bubble, supply was coming online way to fast. The market overshot. Now the market is undershooting as all the excess supply gets worked off in the market.
But when it comes to the fundamentals of supply and demand, we expect housing demand will rebound to around 1.2 million units per year in time.
That’s good news for all the companies that live off the housing demand like homebuilders, lumber producers, and companies that make drywall and bricks.
The real question is though, will housing prices actually recover? And if they do, by how much?
How to Know When the Bottom is In
In the post-housing bubble world, consumers look at what they can afford, not how much they can “flip” a house or how much equity they’re going to get while only paying interest on their mortgages.
That’s why we have to look at what really drives housing prices in a normalized housing market: income, rental rates, and interest rates.
They tell the full story of where housing prices are headed.
Price-To-Income
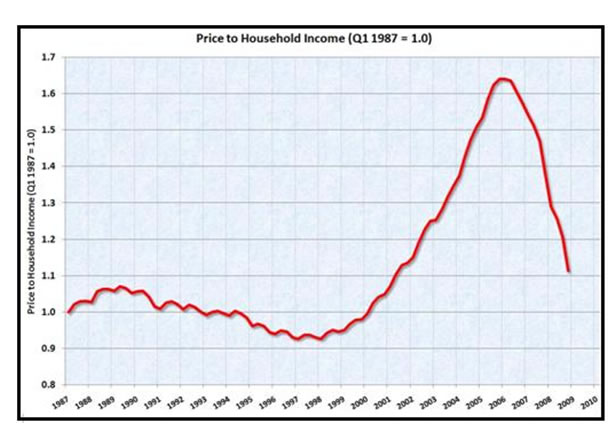
The charts below show the historical price-to-income ratio of houses (Hat tip, Calculated Risk):

The price-to-income ratio relates the national median housing price to the national median income level. Historically, they are about even.
As the chart shows, the housing bubble changed all that. Home buyers weren’t concerned with what they could afford. They focused on how much they could buy. As a result, the price-to-income ratio peaked at an unsustainable ratio of more than 1.6.
Jump ahead to today and the ratio has fallen by about 30% (no accident the median housing price fell about 30% too). But it’s still at the high end of the pre-bubble average at 1.1.
That means, on a relative to income basis, the houses are still overpriced and could easily fall another 10%. And if the market undershoots as it tends to do after bubbles, it could fall even more.
Price-to-Rent
The other key factor affecting the fundamental values of housing is rent.
After all, if housing prices fall too low relative to rent rates, investors will buy the houses to rent them out. Also, if prices are too high and rents too low, potential buyers would just rent because it’s actually much cheaper.
All that helps put a floor in housing prices.
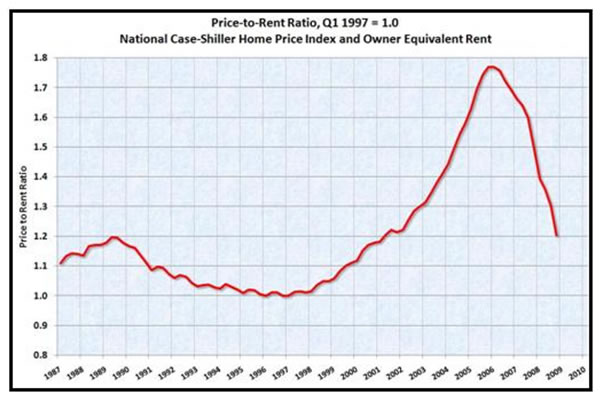
The chart below shows the ratio of price-to-rent:

Once again, during the bubble relative housing prices were extremely skewed.
Housing prices went up, but rents did not go along with them. As a result, the price-to-rent ratio climbed to more than 1.7 at the peak.
At this point, investors were unable to rent their places to cover even most of the costs.
It was a situation that could not last. Either rents had to go up or prices had to go down.
Now that prices have fallen significantly, the price-to-rent ratio is much closer to the historical norm of about 1.1. However, at 1.2 it’s still too high and either rent have to go up or prices have to go down.
Given the other factors like price-to-income, it’s much more like prices will come down.
Interest Rates: The Wild Card
The final major factor affecting housing prices is interest rates. Since most homes are bought with borrowed money, the interest amount portion of a homebuyers’ mortgage payment will vary greatly with interest rates.
For example, someone who wants to buy a $200,000 house today with a 30-year mortgage would lock in the current 5% annual interest rate. The monthly payment would be $1,073 a month.
Interest rates, however, are at historically and unsustainable lows. As we’ve discussed in the past, they only have one way to go from here – UP.
In our example, a seemingly small 1% increase interest rates would push the monthly payment up to $1,199. A 2% increase would push the monthly mortgage payment up to $1,330. A 3% rate increase, which we expect to happen in the next couple of years, would push the monthly mortgage payment up to $1,467.
A 3% increase in interest rates would result in a 36% increase in the monthly payment a buyer would have to pay.
On top of all that, there are additional monthly expenses that are going up too. The largest of which are taxes. As states and local municipalities face widening budget deficits, they’ve turned to property taxes as a way to increase revenues. That just adds to the monthly costs of buying a home and would therefore just add to the downside.
Put all this together and interest rates rising will force housing prices down even more.
Houses are Still a Falling Knife
The three key elements of determining fundamental housing values all show housing prices are still too high.
At this time, we see a recovery in housing construction and demand, but we don’t see a recovery in housing prices anytime soon. Even after a 30% correction in prices, houses are still too expensive.
Now, we know the government has done everything it can to prop up the housing market. From tax credits to the Fed buying mortgage securities, no price has been too high.
The housing bubble was just like any other bubble. Prices must fall to a point where all the excess supply will be bought. All the costly government efforts have merely been delaying the inevitable.
So over the next few months the market will likely see a recovery in construction and Wall Street may view it as great news, we’ll still know housing is still in a bear market.
All is not lost though. Housing may not be a safe place to put your investment dollars to work, but in the next Prosperity Dispatch we’ll look at one spot that is. In fact, the last time this sector was this cheap, investors doubled their money in less than a year.
Until then. Good investing,
Andrew Mickey
Chief Investment Strategist, Q1 Publishing
Disclosure: Author currently holds a long position in Silvercorp Metals (SVM), physical silver, and no position in any of the other companies mentioned.
Q1 Publishing is committed to providing investors with well-researched, level-headed, no-nonsense, analysis and investment advice that will allow you to secure enduring wealth and independence.
© 2010 Copyright Q1 Publishing - All Rights Reserved
Disclaimer: The above is a matter of opinion provided for general information purposes only and is not intended as investment advice. Information and analysis above are derived from sources and utilising methods believed to be reliable, but we cannot accept responsibility for any losses you may incur as a result of this analysis. Individuals should consult with their personal financial advisors.
© 2005-2022 http://www.MarketOracle.co.uk - The Market Oracle is a FREE Daily Financial Markets Analysis & Forecasting online publication.


