U.S. Dollar Trend Driving Gold, Stocks and Commodities
Commodities / Gold and Silver 2010 Mar 22, 2010 - 10:31 AM GMT It is clearly evident that the direction of the dollar looms large in the general direction of other markets: stocks, commodities, and the precious metals to name but a few. These inter-market correlations do not respond tick by tick, or day by day, but over time they obtain; and to deny them their due can be a costly mistake.
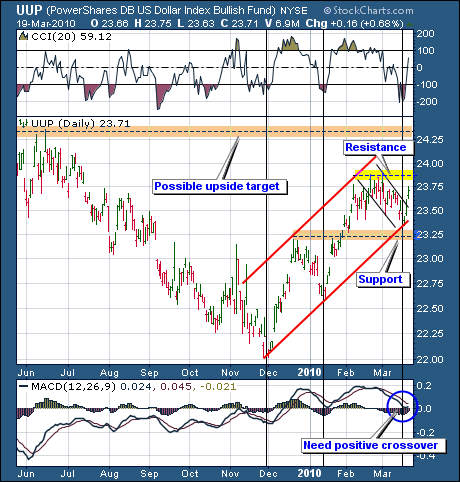
The daily UUP (dollar) chart shows the dollar breaking out and above its falling flag formation (+1.4% wk +3.7% y-t-d). Support was tested and held, and now resistance is about to be tested. Notice that a positive MACD crossover has not yet occurred, and is needed for confirmation. It is possible that the breakout fails. As of now the path of least resistance appears up.
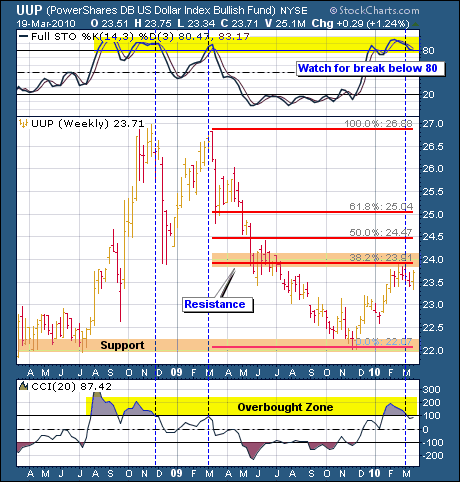
The weekly chart shows a bit of a different picture from the daily. STO appears to be getting ready to break below the 80 level, which, as can be seen by following the blue-dotted vertical lines, usually leads to a correction. CCI has already broken below the 100 level, but is now trying to regain the lost ground.
Overlaid on the chart are a set of Fibonacci retracement levels. Notice that price has previously bumped up into its 38% level, which acted as resistance and stopped its advance. It is about to test that level once again. The dollar may break through resistance on this try; or it may be repelled again. The signals are mixed.
Gold
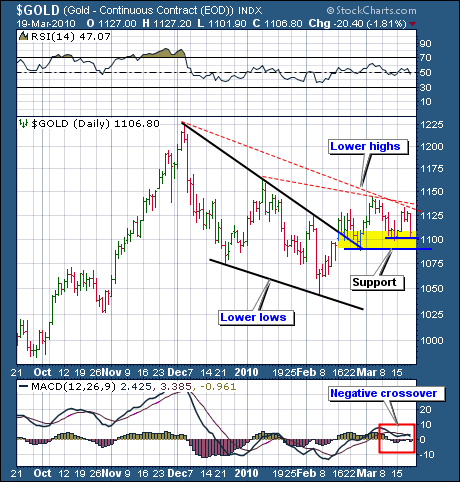
Gold was up $4.80 (0.44%) for the week, although it was down hard on Friday, falling -20.40 to close the week out at $1106.80. The chart below shows gold breaking out of a falling wedge pattern in mid-Feb.
It advanced and then corrected, testing the breakout level, which held. Subsequently, gold advanced to around 1150. It then corrected and rallied again, this time putting in a lower high.
Presently, it is testing support extending back to its earlier March low & the Feb. breakout. If support doesn’t hold, a test of the late Feb. low is likely. MACD has made a negative crossover, suggesting more downside action.
Gold is pretty much sitting on the fence: it is either going to hold its recent breakout or fail. The above two charts (discussed in full report for subscribers) show either scenario is possible.
If gold does break down, then a test of support at $1000 becomes more likely. It could go either way. A lot will depend on what the dollar and the euro do.
Gold Stocks
Gold stocks ended the week with a slight gain of +0.32 to close at 45.31 for a gain of +0.71%. Until the dollar broke out on Friday and the stock market finally retreated, the GDX had been up to an intra-week high of 46.84. It gave almost all of the gain back on Friday.
I’m going to quote from last week’s market wrap, as what I said still obtains:
Price is presently testing its 50 ema. If the 50 ema doesn’t hold, the next target would be the rising price channel’s lower trend line around 44.
Considering the stock market is overbought and that gold moved down in spite of a falling dollar, and the weight of the evidence suggests that the path of least resistance for the short term is down.
This volatility is to be expected and is why I warned that the break out in gold might prove to be a short lived trading opportunity at best. Unfortunately, this seems to be the case.
It will be important to see if the GDX can put in a higher low than its earlier March low, especially if it occurs near lower trend line support at 44. This could lay the groundwork (base) for a sustainable rally.
A lot will depend not only on the direction of gold, but on the direction of the dollar and the overall stock market as well. This is why the gold stocks are much riskier than physical: the dollar, gold, and the overall stock market need to be trending in sync (dollar down – physical gold & stock market up) for the gold stocks to shine. This is not the easiest set-up to maintain, but when it does, it’s a thing of beauty (from last week’s 3/12/10 report).
The most important point in all the above, is the last two sentences, which basically boils down to the fact that for the gold stocks to perform well, a lot of different markets need to be properly aligned:
- dollar (down)
- stock market (up)
- physical gold (up)
Occasionally, one out of the three can be misaligned, and the gold stocks still perform well, but if two or more are out of whack – forget about it, the gold stocks end up getting whacked. However, when the stars are properly aligned, the gold stocks perform like a fine-tuned clock.
With the dollar busting out on Friday, the stock market finally had the excuse it’s been looking for to correct, and the gold stocks went down with it. As one of the email alerts during the week said, although a couple of my recent stock picks (NEM & GOLD) were running up again on Wed., they ended up giving an intra-day gain of over 3% back AND closed down on the day – a nasty reversal.
This is why I booked profits on these stocks and (SWC) a week or so ago and did not buy back in – they were going up for a second time, while gold was not; and while the stock market was overbought and looking for an excuse to go down.
There was too much risk versus reward and the discipline paid off, as the reversal on Wed. was nasty: about a 4% intra-day swing. Sometimes it’s better to be lucky.
This is also why I said that the breakout a couple of weeks ago might be short-lived. The overbought stock market and dollar volatility appeared to be too much for the gold stocks to overcome, at least for now. We’ll see what this week brings. If the dollar continues up, the stock market will continue down, and the gold stocks will follow suit. Once the dollar rally runs its course, however, the markets will likely reverse.
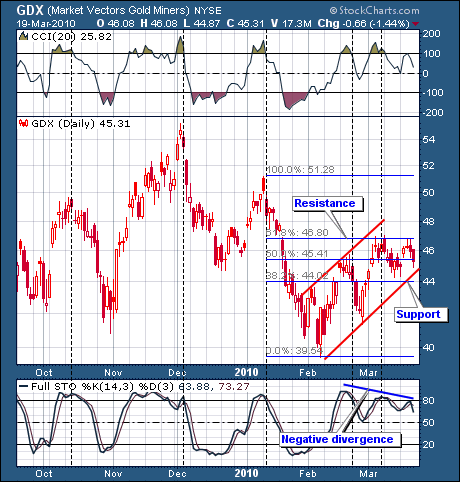
The daily chart below shows price about to test the lower boundaries of its rising channel. If the lower trend line (45) doesn’t hold, then the 38% Fibonacci level near 44 will be tested.
Notice the negative STO divergence mentioned last week, as well as the series of lower highs. The dotted vertical lines show CCI has broken down from overbought levels to below 100 (25). These moves act as good signals of impending corrections when coupled with similar moves down by STO.
Good luck. Good trading. Good health, and that’s a wrap.

Come visit our website: Honest Money Gold & Silver Report
New Audio-Book Now Available - Honest Money
Douglas V. Gnazzo
Honest Money Gold & Silver Report
About the author: Douglas V. Gnazzo writes for numerous websites and his work appears both here and abroad. Mr. Gnazzo is a listed scholar for the Foundation for the Advancement of Monetary Education (FAME).
Disclaimer: The contents of this article represent the opinions of Douglas V. Gnazzo. Nothing contained herein is intended as investment advice or recommendations for specific investment decisions, and you should not rely on it as such. Douglas V. Gnazzo is not a registered investment advisor. Information and analysis above are derived from sources and using methods believed to be reliable, but Douglas. V. Gnazzo cannot accept responsibility for any trading losses you may incur as a result of your reliance on this analysis and will not be held liable for the consequence of reliance upon any opinion or statement contained herein or any omission. Individuals should consult with their broker and personal financial advisors before engaging in any trading activities. Do your own due diligence regarding personal investment decisions. This article may contain information that is confidential and/or protected by law. The purpose of this article is intended to be used as an educational discussion of the issues involved. Douglas V. Gnazzo is not a lawyer or a legal scholar. Information and analysis derived from the quoted sources are believed to be reliable and are offered in good faith. Only a highly trained and certified and registered legal professional should be regarded as an authority on the issues involved; and all those seeking such an authoritative opinion should do their own due diligence and seek out the advice of a legal professional. Lastly Douglas V. Gnazzo believes that The United States of America is the greatest country on Earth, but that it can yet become greater. This article is written to help facilitate that greater becoming. God Bless America.
Douglas V. Gnazzo © 2009 All Rights Reserved
© 2005-2022 http://www.MarketOracle.co.uk - The Market Oracle is a FREE Daily Financial Markets Analysis & Forecasting online publication.


