


Stock and Gold Market Trading Range Madness
Stock-Markets / Financial Markets 2010 Mar 21, 2010 - 04:31 AM GMTBy: Clif_Droke

 One of the most salient observations that can be made in the financial market is the tendency of market averages to enter lengthy trading range after a prolonged uptrend or downtrend. This temporarily directionless trend of prices, or consolidation, within a range creates a psychological discomfort among investors that at times is quite palpable. Taken to an extreme, a trading range tends to manifest itself emotionally among market participants and in ways that can be sometimes be observed even in non-participants. The longer the market continues in a lateral or directionless range, the more discomfited the crowd tends to be.
This observation can be applied to stock and commodity markets but especially applies to the broad NYSE stock market. The emotionalism generated by a prolonged trading range is even more pronounced on the collective psyche of gold and gold stock investors. Take for instance the last eight weeks. During this time the market, as measured by the XAU Gold Silver Index, has gone essentially nowhere. A lateral consolidation pattern is clearly visible in the daily chart of the XAU. During the time it has taken for the XAU to etch out this trading pattern we’ve seen the psychology of the independent retail investor run the gamut between extremely bearish to excessively optimistic and everything else in between. This example is a microcosm of what develops in the course of a much longer trading range pattern.
Investors can be optimistic when the trading range first develops. This especially holds true if prior to the start of the trading range the market settles into a lateral consolidation pattern for several days. The initial enthusiasm of investors then wears off and traders begin to take some of their profits off the table, which in turn creates the initial decline to the lower boundary of the trading range. As the range continues to build and the market exhibits a listlessness and clear lack of direction, investors’ patience begins to wear thin. If the range continues for more than a month it will eventually take a toll on their psychology.
The patience of investors begins to strain as volatility wanes and the opportunities for making money in a listless market dwindles. It’s at this point that a distinctive shift in investor sentiment can be noticed. My broker friends tell me that as a multi-week trading range wears on they begin to receive calls from impatient clients who at first inquire as to why the market isn’t moving higher. As the range continues even further the calls from investors become decidedly more emotional as impatience gives way to frustration. When the market’s directionless trend continues beyond 10 or 12 weeks, that frustration often gives way to outright anger or despair.
Let’s now take a minute to discuss the mechanics of a trading range. In the XAU Index, a lateral trading range is the result of crisscrossing internal currents. These currents are partly created by a confluence of ascending and descending weekly and/or yearly cycles. When the cycles are primarily in harmony in a given direction the market will typically follow the directional lead of the cycles. From March of last year, for instance, the sub-dominant interim weekly trading cycle bottomed while the 10-year cycle entered its “hard up” ascent. This accounted for the strong performance in the XAU from March until October.
Since January, however, the cycles have been out of synch, which explains why the trading range in the XAU has developed. Within the space of just the last few weeks we’ve seen a major interim weekly cycle peak, a major interim weekly cycle bottom and a short-term cycle bottom and peak, respectively.
Cycles are one way of evaluating a trading range and predicting the most likely direction that price will follow once the breakout from the trading range occurs. Another way of guessing the most likely directional resolution of the trading range is to observe the dominant direction of the internal momentum indicators prior to the breakout. In most cases the market will follow the internal path of least resistance, meaning that if most of the short- and intermediate-term indicators are rising while the market is consolidating in a range the market’s next directional move is likely to be to the upside.
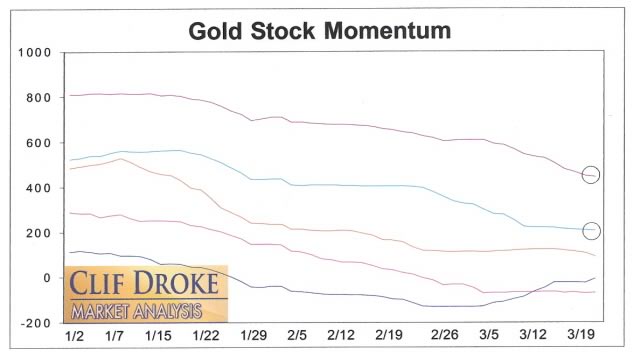
This brings us to the latest market observation. The internal momentum configuration for the gold stock group hasn’t been ideal for a sustainable rally in the gold stocks for some time. The dominant long-term momentum indicator (circled line at the top of the chart), which had been rising throughout 2009, has been in a sustained declining trend since January. This has acted as a weight dragging down the gold stock group as a whole. Meanwhile, the dominant intermediate-term internal indicator (light blue line, circled) has also been declining in recent weeks, adding further stress to the mining stocks. Only the rising short-term indicator (dark blue line at the bottom of the chart) has kept the near term price level buoyant in the face of the negative interim and longer-term momentum currents. It will take a general improvement in the interim momentum structure of the gold stocks to pave the way for a resumption of the recovery.
Another way of analyzing a market neutral trend is break down the market’s various components into sub-sectors and groups, viz., small caps, mid-tiers, large producers etc. In this way you can avoid the frustrations that normally attend a lateral range by taking advantage of the strongest or weakness market segments. This is where the internal momentum indicators are worth their weight in gold since they allow you to evaluate the internal currents of the various market segments.
Returning to our original proposition, what happens when a trading range extends beyond 12 weeks duration? We experienced a good example of this during the first half of 2004. After the strong rally of 2003 in the broad market, the market hit a temporary top and spent the first seven months of 2004 consolidating its gains within the confines of a trading range. From July until August this range had a downward slope due to the influence of the 10-year cycle, which bottomed that year.
The temperament of investors in 2004 was extremely negative. To express a bullish opinion in 2004 was to invite scorn and contempt from most market participants. To write a market commentary with a bullish conclusion was to invite a plethora of angry response. The year 2004 was a text book year for observing the feelings of anger and frustration bordering on madness that a lengthy trading range often evokes.
The year 2005 turned out to be another elongated trading range for the S&P 500. Instead of a downward sloping trading range, however, the trading range of 2005 had an upward bias since the 10-year cycle had bottomed in late 2004. Nonetheless, since the SPX was in a trading range from January through October the patience of most investors was stretched to the breaking point by the time the market finally broke out from its trading range in November. It was during 2005 that bearish investor sentiment reached a climax of sorts as measured by the AAII sentiment index. Clearly the trading range had against succeeded in driving investors to “madness.”
Probably no better example of how a long-term trading range exerts a negative impact on investor psychology exists than the decade of the 1970s. Viewed in its entirety, the period from 1970 through 1979 was a massive lateral trading range for the Dow Industrial Average. This long, grueling trading range induced so much frustration that by the end of that decade the sentiment it produced was expressed by the infamous “Death of Equities” magazine cover published by Business Week. It also led to one of the more famous catch phrases of the ‘70s in pop culture: “I’m mad as h--- and I’m not going to take it anymore!”
Lest you think I’m belaboring the point, there’s a valuable lesson to be learned from all of this. While it’s easy to get caught up in the frustration that a prolonged trading range tends to produce, that frustration can be avoided by reminding yourself that a trading range is the result of conflicting market currents. For every downward current among the major market sectors there is also a rising current somewhere.
The key to capitalizing on this is to not get caught up in concentrating on the lackluster action of the major indices but instead to focus on individual sectors and industry groups. Once you’ve found the sectors that are showing relative strength and forward momentum you can then start looking for the strongest individual stocks within those sectors. This is the golden key that unlocks the profit potential of a market neutral trading range environment. It’s also the meaning behind Jesse Livermore’s famous phrase, “No man living can beat the market,” i.e. it’s best to focus on individual stocks rather than obsess over the direction of the broad market.
One more thing is worth mentioning in our discussion of trading ranges. In the treacherous trading environment of the 1970s, investors tended to concentrate their attention on the directionless Dow, which only added to their misery. The tech sector as reflected by the NASDAQ Composite Index, however, was making steady upward progress at that time. By the end of the ‘70s, the NASDAQ experienced a blow-out performance on the upside compared to the Dow and it was clear that the tech stocks benefited more from the 40-year cycle bottom in 1974 than the Industrials did.
This was a figure of things to come in the ‘80s and ‘90s but more to the point, it serves to illustrate that even within the most frustrating of market environments there is always opportunity waiting to be found somewhere if only you take the time to look for it. This example can be further extended to our 2005 example: while the Dow and S&P were mostly range-bound that year, the NASDAQ was in a rising trend, as were the gold stocks and some other major industry groups.
Never lose sight of this important truth and you’ll avoid getting a case of “trading range madness” and you’ll also be able to profit from even the most challenging market environments.
Tape Reading
There’s no substitute for good, solid market analysis when it comes to stock trading. Fundamental analysis is important, too, but for traders with a short- to intermediate-term outlook, being able to “read the tape” is a skill worth its weight in gold. Watching the flow of trading volume in a stock in relation to its price level can provide a major edge in buying and selling at the right time. The great advantage the tape reader enjoys over other traders who don’t use a scientific approach is that the tape reader can decide which side of the market affords the best opportunity for profit. By process of elimination, the tape reader either gets in at the commencement of a price movement or else waits for the first reaction after the move has started. As the famous market technician Richard Wyckoff observed, “Tape reading gets you in at the beginning, keeps you posted throughout the move, and gets you out when it has culminated. It has made fortunes for the comparatively few who have followed it.”
It was for the purpose of distilling tape reading to its essence that I wrote “Tape Reading for the 21st Century” in 1999. Now in its third edition, this book explains the basics of tape reading in layman’s terms. The book uncovers the mechanics of tape reading and provides the most essential rules and guidelines for understanding volumes and how they can be used to predict stock price movements. This book
You won't find these techniques in a copy of Edward's & Magee's book on technical analysis or anywhere else. These reliable "tricks of the trade" are available to you in Tape Reading for the 21st Century. Click here to order:
http://www.clifdroke.com/books/book05.mgi
By Clif Droke
www.clifdroke.com
Clif Droke is the editor of the daily Gold & Silver Stock Report. Published daily since 2002, the report provides forecasts and analysis of the leading gold, silver, uranium and energy stocks from a short-term technical standpoint. He is also the author of numerous books, including 'How to Read Chart Patterns for Greater Profits.' For more information visit www.clifdroke.com
Clif Droke Archive |
© 2005-2022 http://www.MarketOracle.co.uk - The Market Oracle is a FREE Daily Financial Markets Analysis & Forecasting online publication.