Watching VIX for Signs of Topping Stock Market
Stock-Markets / Stock Markets 2010 Mar 19, 2010 - 03:08 PM GMTBy: Mike_Paulenoff
There are so many crosscurrents today -- options expiration, healthcare reform, S&P rebalancing, among other things. Let's see if the VIX-SPX relationship can shed any light on what the market is "really" doing...
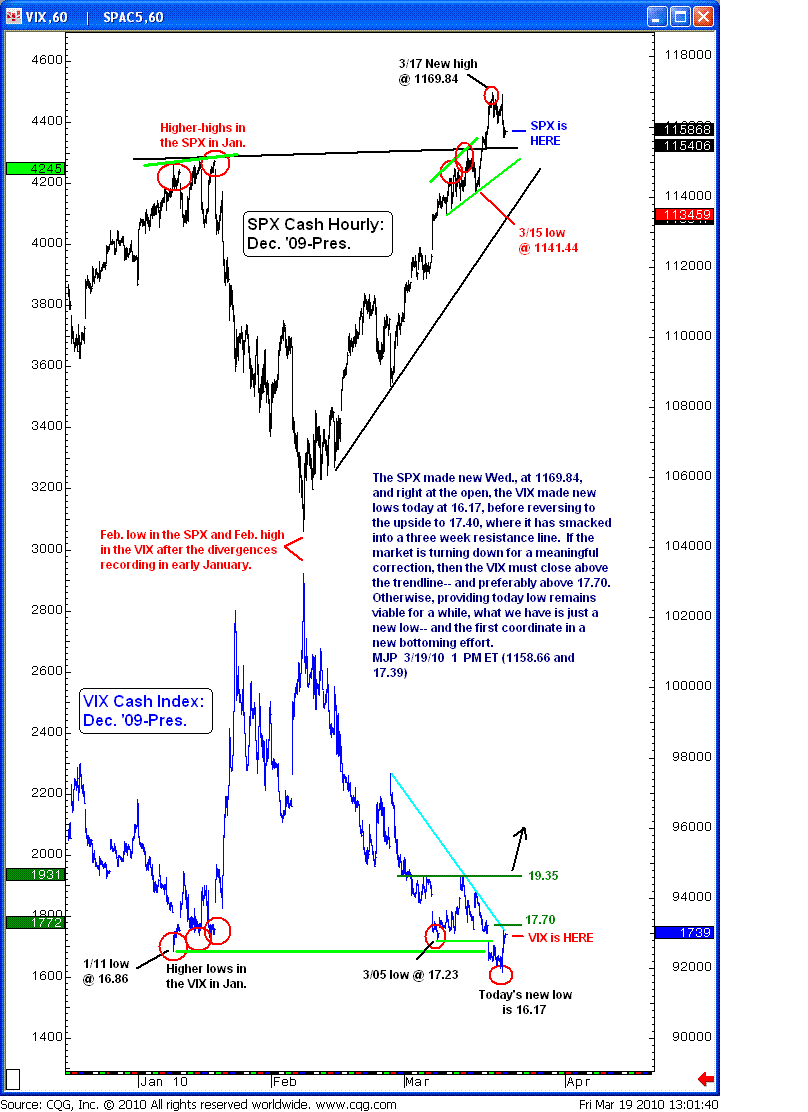
The SPX (cash S&P 500 hourly chart) made a new high Wednesday at 1169.84, and right at the open the VIX made new lows today at 16.17, before reversing to the upside to 17.40, where it has smacked into a 3-week resistance line.
If the equity market is turning down for a meaningful correction, then the VIX must close above the trendline -- and preferably above 17.70. Otherwise, provided today's low remains viable for a while, what we have is just a new low -- and the first coordinate in a new bottoming effort. ETF traders may want to watch the Barclays Bank iPath S&P 500 VIX Short Term Futures ETN (NYSE: VXX) and the S&P 500 Depository Receipts (AMEX: SPY).

Sign up for a free 15-day trial to Mike's ETF & Stock Trading Diary today.
By Mike Paulenoff
Mike Paulenoff is author of MPTrader.com (www.mptrader.com), a real-time diary of his technical analysis and trading alerts on ETFs covering metals, energy, equity indices, currencies, Treasuries, and specific industries and international regions.
© 2002-2010 MPTrader.com, an AdviceTrade publication. All rights reserved. Any publication, distribution, retransmission or reproduction of information or data contained on this Web site without written consent from MPTrader is prohibited. See our disclaimer.
Mike Paulenoff Archive |
© 2005-2022 http://www.MarketOracle.co.uk - The Market Oracle is a FREE Daily Financial Markets Analysis & Forecasting online publication.


