


Stabilizing Tax Revenues Is this Economic Recovery Secretly Strong?
Economics / Economic Recovery Mar 16, 2010 - 02:29 AM GMTBy: John_Mauldin

 Long time readers of Thoughts from the Frontline will be familiar with the name The Liscio Report. It is one of my "secret" sources of high quality analysis on a wide range of topics including taxes, employment and the underpinnings of the economic headlines that we read which can be so distorted. I say secret because they get nowhere near the attention their work deserves. Philippa Dunne & Doug Henwood, authors of The Liscio Report, do actual on the phone conversations with each of the various states on their tax collections, employment and so on. I find their primary research to be invaluable. Their real time proprietary research based on state withholding and sales tax receipts gives their clients a unique insight into the state of the US economy.
I have talked them into letting me send out their most recent letter, which I found very informative. While their work is not inexpensive ($7,500 annually), for hedge funds, banks, proprietary trading desks and those who need to know what is actually happening as opposed to whatever spin is being put out in the press, you should check them out at www.theliscioreport.com.
And before we jump into their report, I feel the need to comment on the revelations this last week about Lehman and what looks like can only be called fraud. How much more of this is going on? Regulators now have a road map to know what to look for. Auditors are now on notice that this lack of transparency and cooking the books at quarter's end must not be condoned.
And while we're on the topic of transparency, for God's sake, can't we get credit default swaps on an exchange before they blow us all up again? Please? Someone? Anyone? It's been two years. It's what brought Bear and Lehman down. Bluntly, the reason the banks oppose this is that the commissions for an OTC credit default swap are astronomical when compared to what will become a $10 commission on an exchange.
OK, I'll now stop my rant, and allow you to enjoy The Liscio Report. Have a great week.
John Mauldin, Editor Outside the Box
Revenues stabilizing, though it helps to be rich
The Liscio Report By Philippa Dunne & Doug Henwood
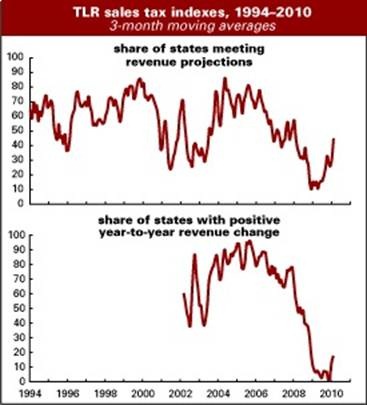
In February, 56% of the states in our survey met or exceeded their forecasted sales tax collections, up from 50% in January, and 13% reported positive collections over the year, down from 30% in January. Our intensity index, over-the-year rate of change weighted by state population, was -2.33%, about even with January's -2.28%, and the aggregated divergence from forecast held in the positive range at 0.26%, down a bit from January's 0.5%.
Both of the two last measures are showing real improvement: the over-the-year change, although still negative, is well off its record-setting lows (see below) and the divergence from forecast, with a few small exceptions, hasn't been positive since the fall of 2006.
For the various geographic regions, the good news is generally of a muted variety, and uneven no matter how you break them up. The best results came from states with large investment banking sectors--a few were both positive over the year and above forecast, one quite substantially so. The housing-bubble states without such sectors are slowly clawing back in the long, slow haul they anticipated, with one actually beating forecast by a hair.
The Midwestern manufacturing states continue to report mixed results. One reported the strongest year-over-year gains in the survey, and our contact there believes the relative stability of the major auto-makers is allowing "those who have jobs" to spend a bit more freely. Other states in the region did not do so well, but continue to report a stabilizing trend.
Greatest impatience was expressed by revenue officials around the country in smaller states with mixed economies. They expect to see revenues now moving into positive territory and another month of disappointing results is hard to take.
affluent tightwads
For the last two years, Gallup has been asking 1,000 Americans every day how much they've been spending at stores, restaurants, gas stations, and online. The average for upper-income households--those with incomes above $90,000--in February plunged to a new low of $98, down 13% from January. The numbers aren't seasonally adjusted, so the monthly changes have to be taken with a grain of salt, but the yearly change is a sharp -19%.
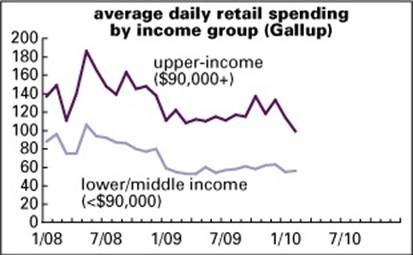
By contrast, spending by middle- and lower-income households has been more or less flat for a year. Both are way off their May 2008 peaks--down by almost half for both groups.
As Gallup's chief economist, Dennis Jacobe, pointed out in reporting these results on Wednesday, the retail economy badly needs freer spending by the well-off. That's where most of the discretionary juice is; households of more modest means just don't have the money to ramp up spending beyond the level of basics.
Jacobe attributes this tight-fistedness to "the new normal"--a general cautiousness born of economic uncertainty. Upper-income households are much less exposed to the vagaries of the job market than middle- and lower-income ones. For example, as a study by the Center for Labor Market Studies at Northeastern University reported in February, at the end of 2009, the average unemployment rate for the upper fifth of the income distribution was 2%; for the middle fifth, it was 6%; and for the bottom fifth, it was 19%.
the new normal
It's not just Gallup that's talking about a new regime of lower spending. In a new joint report, the consulting firms Kantar Retail and Price Waterhouse Coopers declare that "an enduring shift has taken place as a result of the Great Recession." Conspicuous consumption will give way to a more mindful sort of spending, and "rampant deal-seeking will be replaced by more purchases selectivity." Over the near future, people will apply the tools and consciousness they learned during the recession even as the economy recovers. Shoppers will put more effort into buying. Gone are the days of recreational browsing and impulse buying; shoppers will plan their purchases more, making lists and Googling for deals. There will be a stigma attached to wasteful spending--and purveyors of luxury goods will have to content themselves by selling to the actually rich alone, without any help from the aspirationally affluent. "Good enough" will take the place of the very best. The mix of goods may change. As Boomers approach retirement, they'll spend less and save more, ceding the cyclical lead to Gens X and Y--which means a bigger role for high-tech gadgetry. But overall spending is likely to remain muted.
Or so they say. The older among us, or the subset of those with still-intact memories, will recall that similar things were said in the early 1990s, when private labels and generic goods were all the rage. That trend faded as the job market recovered, the stock market bubble got going, and the former Chevy driver eventually just had to have an Escalade. Still, this sobriety is likely to be with us for some time--at least until the job market seriously recovers.
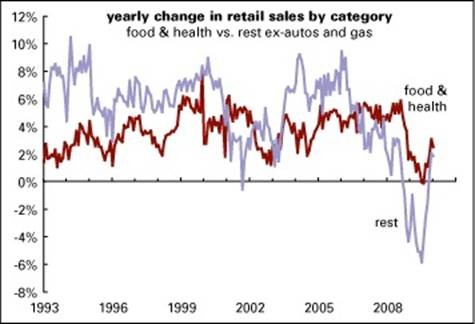
That said, spending on nonessentials has been recovering in recent months. Its growth rate is still lagging that of essentials, but the gap is closing. That's to be expected, but a return to 2006 certainly isn't.
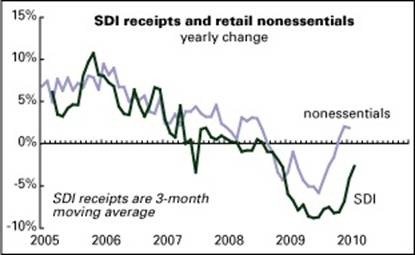
By the way, as the graph below shows, the yearly change in sales tax collections in the SDI's universe correlates very nicely with movements in spending on nonessentials (r=0.87). This makes sense, since so many essentials are exempt from sales tax, but it's always gratifying when you can confirm good sense empirically.
Is this recovery secretly strong?
Every now and then you hear respectable analysts claiming that this recovery is stronger than anyone knows, or admits, or wants to contemplate. Rodney Dangerfield, who couldn't get no respect, is invoked in support of this claim.
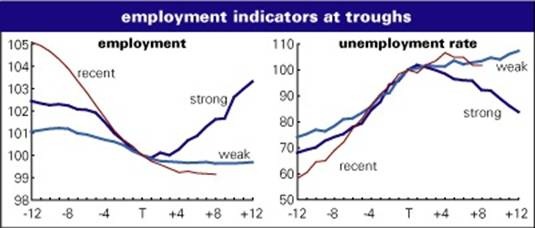
We wish we could find something this encouraging in the data. To take the measure of the recovery, we've put together four cycle graphs, showing the behavior of some important indicators for the year before and after business cycle troughs. In all but one case (more on that one in a bit), values are indexed so that the trough month = 100. (We're assuming that the trough of the recent recession was in June 2009.) But instead of the usual recovery average, which blends together all upturns since the end of World War II (and which is how we've done this exercise most times in the past), we've done two averages--one representing the weak recoveries of 1991-1992 and 2001-2002, and the other, the strong recoveries of 1975-1976 and 1982-1983.
Graphed below are payroll employment and the unemployment rate. The recent trajectory of both measures is a lot closer to the "weak" line than the "strong." Employment is actually weaker than the "weak." In fact, if employment were hugging the "weak" line, there'd be over 600,000 more jobs in the economy than there were in February. If it were following the "strong" path, there'd be 3.2 million more jobs. Unemployment is close to the "weak" line; if it were following the "strong" path, the jobless rate would be a full point lower than it was in February.
Of course, the job market is only one part of the economic picture--though it's a very important part. What about the broad business cycle indexes? These have the virtue of giving a composite picture of all the economy's major aspects--and using them is a nice check on the temptation to cherry-pick data to prove the point you want to prove.
Two of those composite indexes are graphed below--the Conference Board's coincident index and the Chicago Fed's National Activity Index (CFNAI). The Conference Board index, after having fallen hard in the recession (like the employment indicators), is almost a dead-ringer for the "weak" line.
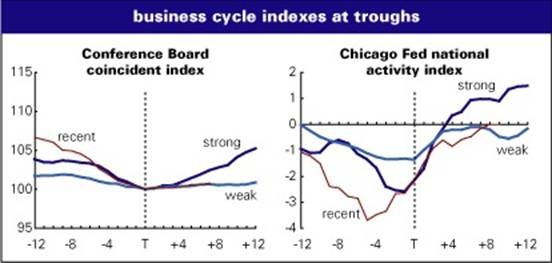
The CFNAI is the only one of these indicators that isn't indexed so that the trough month is set to 100. The reason for that is that the index itself is normalized over time so that its long-term average is 0, which is also the economy's long-term trend growth rate. Any value above 0 is over trend; any under 0, under trend. A value of 1 is a standard deviation above average. Values above .70 are thought to be where the economy is running far enough above trend that inflation is a worry. Historically, the CFNAI has proven to be a good real-time measure of the state of the business cycle.
Here too, we're much closer to "weak" than "strong"--and still below 0. Seven months into a strong recovery, the CNFAI has averaged 1.0--meaning that we're more than a standard deviation below a strong recovery's reading.
So, no, this is not a Rodney Dangerfield recovery. Maybe it will become one--but we doubt that the markets will be inclined to badmouth the strength of the thing in the coming months.
Philippa Dunne & Doug Henwood
John Mauldin
Editor, Outside the Box
By John Mauldin
John Mauldin, Best-Selling author and recognized financial expert, is also editor of the free Thoughts From the Frontline that goes to over 1 million readers each week. For more information on John or his FREE weekly economic letter go to: http://www.frontlinethoughts.com/learnmore
To subscribe to John Mauldin's E-Letter please click here:http://www.frontlinethoughts.com/subscribe.asp
Copyright 2010 John Mauldin. All Rights Reserved
John Mauldin is president of Millennium Wave Advisors, LLC, a registered investment advisor. All material presented herein is believed to be reliable but we cannot attest to its accuracy. Investment recommendations may change and readers are urged to check with their investment counselors before making any investment decisions. Opinions expressed in these reports may change without prior notice. John Mauldin and/or the staff at Millennium Wave Advisors, LLC may or may not have investments in any funds cited above. Mauldin can be reached at 800-829-7273.
Disclaimer PAST RESULTS ARE NOT INDICATIVE OF FUTURE RESULTS. THERE IS RISK OF LOSS AS WELL AS THE OPPORTUNITY FOR GAIN WHEN INVESTING IN MANAGED FUNDS. WHEN CONSIDERING ALTERNATIVE INVESTMENTS, INCLUDING HEDGE FUNDS, YOU SHOULD CONSIDER VARIOUS RISKS INCLUDING THE FACT THAT SOME PRODUCTS: OFTEN ENGAGE IN LEVERAGING AND OTHER SPECULATIVE INVESTMENT PRACTICES THAT MAY INCREASE THE RISK OF INVESTMENT LOSS, CAN BE ILLIQUID, ARE NOT REQUIRED TO PROVIDE PERIODIC PRICING OR VALUATION INFORMATION TO INVESTORS, MAY INVOLVE COMPLEX TAX STRUCTURES AND DELAYS IN DISTRIBUTING IMPORTANT TAX INFORMATION, ARE NOT SUBJECT TO THE SAME REGULATORY REQUIREMENTS AS MUTUAL FUNDS, OFTEN CHARGE HIGH FEES, AND IN MANY CASES THE UNDERLYING INVESTMENTS ARE NOT TRANSPARENT AND ARE KNOWN ONLY TO THE INVESTMENT MANAGER.
John Mauldin Archive |
© 2005-2022 http://www.MarketOracle.co.uk - The Market Oracle is a FREE Daily Financial Markets Analysis & Forecasting online publication.