Stock Market Bulls Remain in Control!
Stock-Markets / Stock Markets 2010 Mar 14, 2010 - 10:59 PM GMTBy: Piazzi
 Last week, bulls dominated the market. Keeping the pressure on the shorts, they did not give anything back – not even and intraday pullback.
The trading pattern of last week was quite simple and elegant
Index would go into some king of contraction or range-bound action, and then would expand out of that resolving the range to the upside
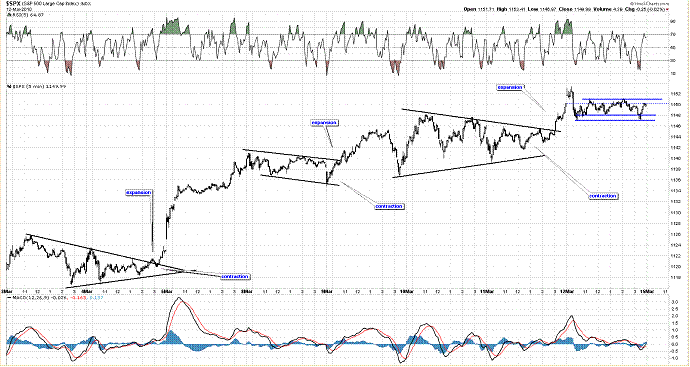
This type of action is typical as a wave keeps extending, can easily happen in a strong 3rd wave or a drawn out C wave.
Notice that Friday ended with another tight price action.
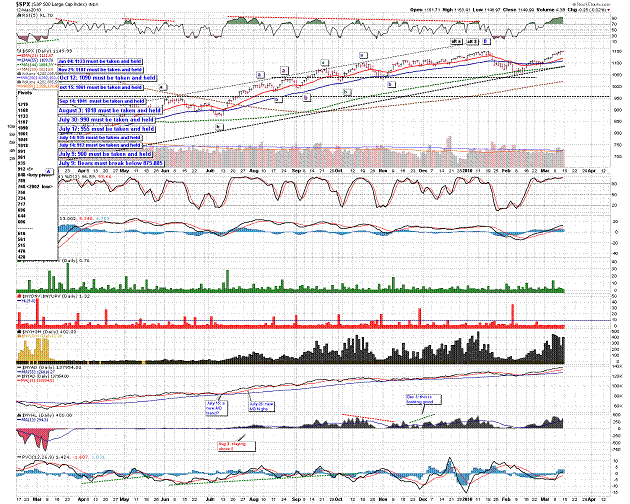
From a much longer term point of view, Index maintained its positive posture.
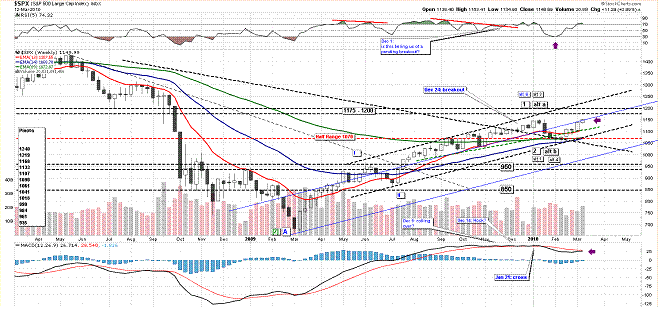
Index is still hitting against the mid-line of a channel that I had laid down from the July low. Weekly MACD is yet to cross and, as I have mentioned, a failure to do so can establish a hook and may be a warning for a pullback. Also, the 34EMA is yet to cross 89EMA, a failure to do so can also form a hook and lead to some pullback or correction. Other than that, there is not much to complain about. Index has good support from its weekly MAs, the lower boundary of the channel, and the half range marker that we have had on the chart for a long time.
I have relegated two of the possible 4 wave counts to very low probability. The two more probable counts at this time are one count that regards January peak as a major wave 1 and February low as a wave 2 (or part of a major wave 2), and one count that regards January peak as a major wave A, and February low as major wave B (or part of major wave B).
This coming week, being an OpEx week, has the potential of clearing the wave structure and reveal which one of the remaining two is the one to prefer to the other.
NDX has already made a new high for the year
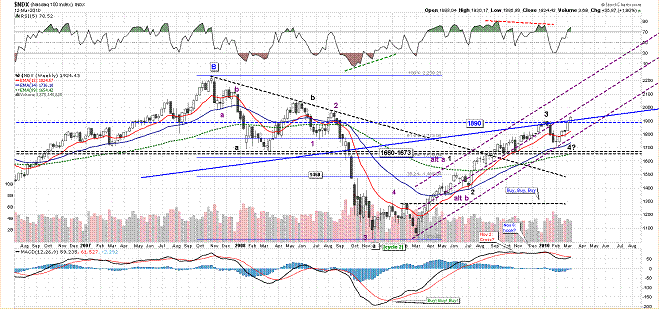
Notice that NDX has broken above the blue resistance line and is approaching the middle of the purple channel. Also notice that MACD is at a juncture where it may either cross or hook. The outcome of these technicals will set the stage for the next move. Other than that, NDX’s chart looks very bullish at this moment. NDX has been leading S&P. It is hard to see S&P through an extremely bearish lens when high beta NDX looks charged with bull spirit and clean waves.
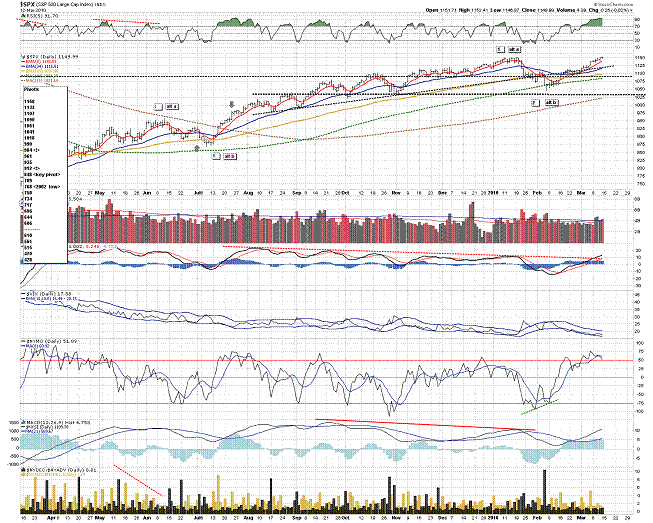
This is a daily chart of S&P
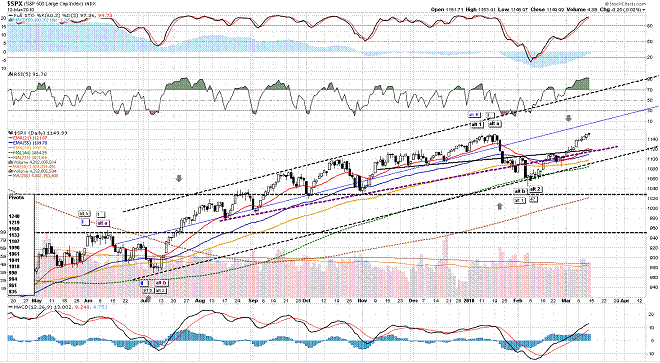
To say that short term momentum is overbought is somewhat an understatement. But that’s what a strong uptrend should do, it should get overbought. The next thing it should do is that when it finally pulls back, it should give back little and, if it’s really strong, do not get fully oversold.
Index has been toying with the January high. The overbought levels may stall the index soon and cause a pullback. I think it may not be very prudent to start a brand new position here.
Breadth has also improved a lot over the recent rally. It was showing signs of getting overbought and on Friday it displayed some moderate signs of slowing down.
McClellan Oscillator pulled slightly back while being overbought
ARMS Index rose and may indicate that softness or correction may soon follow
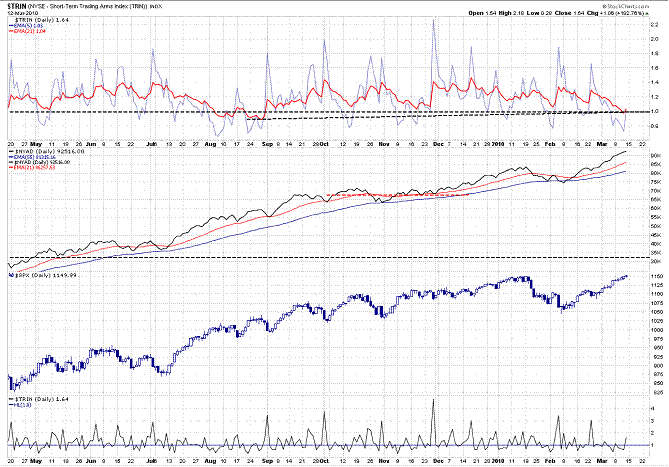
As you can see from the chart below, the rally has had a good breadth, but may be at, or near some sort of a short term top or exhaustion point
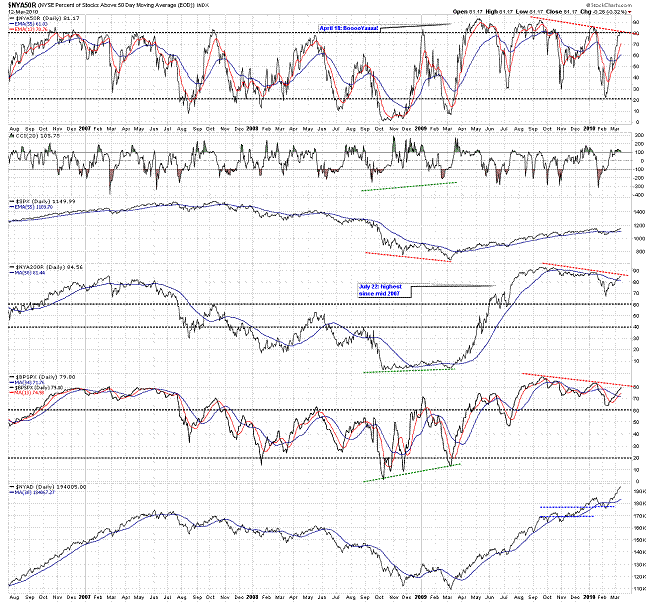
From a purely technical point of view, none of this necessarily means that a collapse is imminent. It just means that things look a bit toppy, and shorter term probabilities may not be favoring a brand new position on the long side. It also means that risk parameters of existing positions may need to be re-evaluated.
This is a 60-min chart of the index
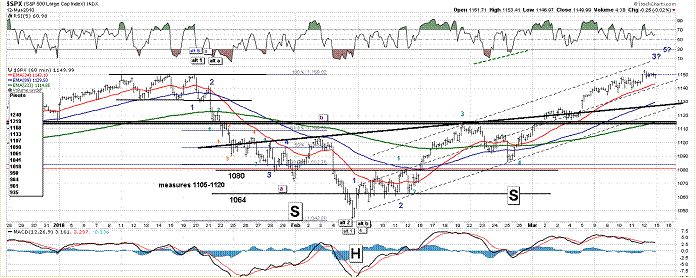
On February 19, I wrote this
“The move from Feb Lows looks very similar to the one from July lows. While future will tell us how similar they will in fact be. I shall remember that the July move destroyed the bears, and also kept a lot of bulls out waiting for a retest or pullback or whatever.”
Not too bad of a call, eh?
From a secondary short term low of Feb 25, index has not given anything back, roasting the shorts alive, and leaving the non-participating bulls in its dust.
We have an active INV H&S shoulder that I talked about on March2. The pattern came to life right after I wrote about it via a strong morning gap, held a small pullback and then went racing on. The July massacre of the bears also got into gears via a strong gap leaving many behind.
So far, the move off the Feb lows has been very strong and broad-based. Bears keep telling us that volume is absent, but these past few days had decent volume on S&P and the whole move has had decent volume on NDX which has been a leading index. Also, as I have mentioned before, with a composite, volume may come after price moves for a while as many either join the party later or are squeezed into submission to the move. Regardless, volume is not a trading trigger, it may give warning as to a move being suspect but that’s all there is to it: A potential warning.
Bears also tell us that sentiment is very bullish. My long-time readers know that I regard sentiment reading as a background condition and a warning at best and useless he-said-she-said at worst – definitely not a trade trigger on its lonely own.
Instead of conducting a round-the-clock talk show of complaints about volume and sentiment, how about bears do something destructive about the price and, at the very least, generate a series of short term lower lows and lower highs? I mean: how about actually selling the market down as opposed to talking it down?
I hope bears regard my pokes as a motivational rant and not as any sort of insult because, as much as this is a bulls’ market at this very moment, it would be nothing without the bears ;-)
So, market is overbought and a pullback can happen anytime. I have made no change to my levels. As long as index is above 1110, it is either consolidating or rallying. I would really like 1130 to contain any possible pullback in the hours and days ahead. A move bellow 1130 may be a first warning that 1110 may indeed be tested.
Support is at 1133 and 1107. Resistance is at 1168 and 1179.
Long term trend is up. Mid-term trend is up. Short term trend is up.
This coming week is an OpEx week. We have had a nice, long stretch of a rally. I expect all sorts of price gymnastics.
Have a Nice Week!
By Piazzi
http://markettime.blogspot.com/
I am a self taught market participant with more than 12 years of managing my own money. My main approach is to study macro level conditions affecting the markets, and then use technical analysis to either find opportunities or stay out of trouble. Staying out of trouble (a.k.a Loss) is more important to me than making profits. In addition to my self studies of the markets, I have studied Objective Elliott Wave (OEW) under tutorship of Tony Caldaro.
© 2010 Copyright Piazzi - All Rights Reserved Disclaimer: The above is a matter of opinion provided for general information purposes only and is not intended as investment advice. Information and analysis above are derived from sources and utilising methods believed to be reliable, but we cannot accept responsibility for any losses you may incur as a result of this analysis. Individuals should consult with their personal financial advisors.
© 2005-2022 http://www.MarketOracle.co.uk - The Market Oracle is a FREE Daily Financial Markets Analysis & Forecasting online publication.


