


S&P 500 Stock Market Trends Forecast for March 2010
Stock-Markets / Stock Markets 2010 Mar 11, 2010 - 03:55 PM GMTBy: Hans_Wagner

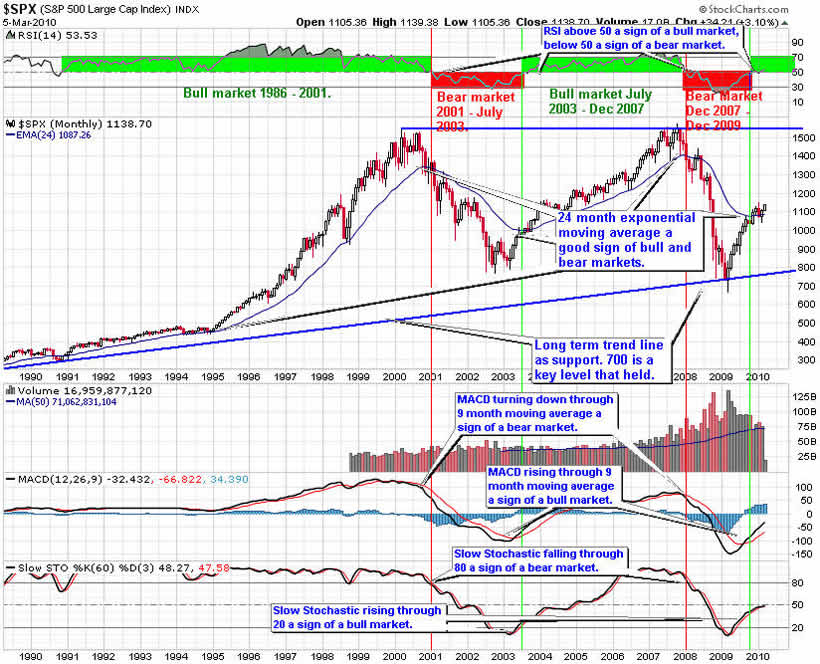
 This is a monthly chart for the S&P 500 showing 20 years of performance. Since this index is the one used by professional traders, it is important to understand how it is performing. This chart is also excellent at defining the longer-term trends for the market.
The bull market of the last five years broke down when the S&P 500 turned down through the 24-month exponential moving average. The bear market began when the index fell through the 24-month exponential moving average. Also, the RSI tested the 50 level, another important indicator of bear markets (if the RSI remains below 50 then we are in a bear market) and turned back down. The MACD crossing down through zero is another sign of the transition from bear market to bull market. Finally, the Slow Stochastic fell through 80 as another sign of the beginning of the bear market.
A stock market bottom forms when each of these indicators reverses and crosses through their signal lines. When the Slow Stochastic rises through the 20 level, we have one signal of a stock market bottom. The MACD climbing through its 9-month moving average is another. The RSI above 50 is another signal to follow for an end to a bear market. Finally, when the price crosses up through the 24-month moving average, we have another signal of end of the bear market.
The rally that began in early March paused in January and February 2010. The index is testing the 24-month exponential average, an important indicator of a bull or bear market.
The RSI is testing the 50 level, a sign of indecision. The MACD is trending up without any resistance above. The Slow Stochastic is trending up through it is approaching the 50 level, a potential resistance area.
It looks like the market paused to consolidate its gains before continuing up. We need to look at the shorter-term charts and the market indicators before making a decision.
For now, I intend to invest as though we are in a more normal market that will see rallies and then pullbacks. The rally of the last nine months came as a rebound from an oversold condition as investors feared the worse. Going forward, we will experience market rallies and pull backs as the economy struggles to expand. The overall trend will be sideways in a range of 900 on the low and 1,250 at the high.
You can click on the link below to see a current version of this chart.
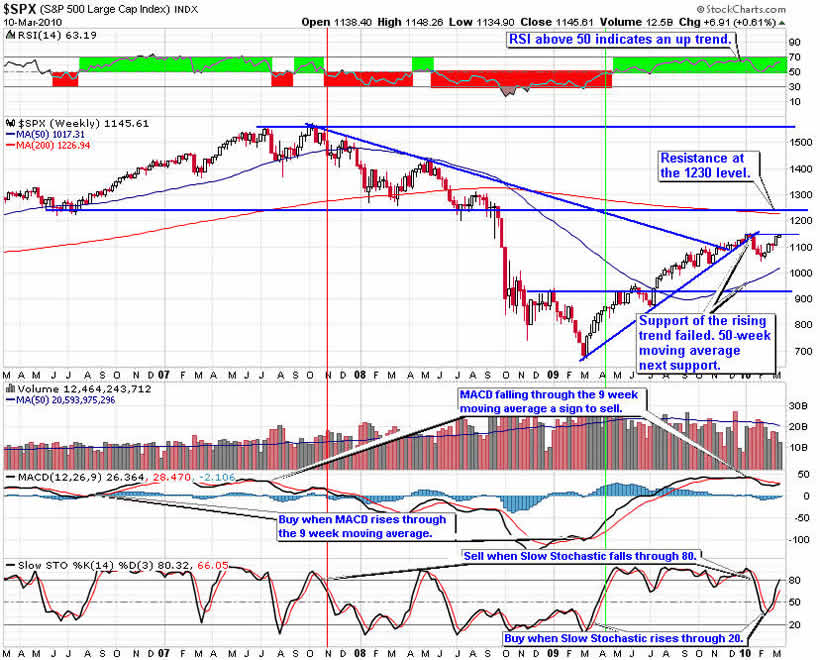
The four-year weekly S&P 500 trend chart shows that the market continues to rise, having broken through resistance of the multi-year down trend. The next resistance level is the 1,240 area or the 200-week moving average.
The rising trend that has been support since the rally started in March failed in January 2010 indicating a pull back in the market. After a brief move down, the S&P 500 rebounded and it is testing the recent high. However, volume is below average, a sign buyers have not joined in the rally so far.
RSI is above 50, a sign of an up trend. The MACD has reached a high point and it is turning down through the 9-week moving average, giving a sell signal. The Slow Stochastic fell through 80 giving a sell sign, though it has rebounded, to negate the sell signal.
The weekly chart pattern indicates the S&P 500 is at a decision point. If it pushes up, it indicates the rally will continue. On the other hand, if it turns down, we will have a small double top, a sign of a move down.
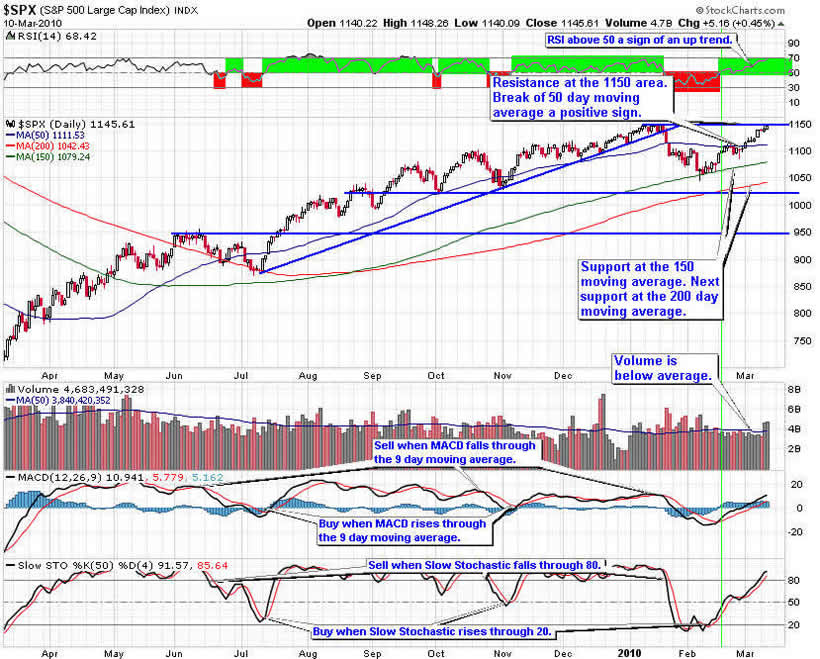
On the daily chart of the S&P, the index rebounded up from support at the 150-day moving average and it is testing resistance at the prior high. Volume on the last two days has been above average, a positive sign. If there is a break out it confirms the rally continues.
RSI is above 50 indicating an up trend. The MACD turned up through the 9-day moving average, giving a buy sign. The Slow Stochastic is above 80 where it will turn down giving a sell sign eventually.
The daily chart of the S&P 500 is telling us the market is in the process of testing whether the recent rally will continue. If S&P pushes resistance, look for the market to rally further.
I am expecting the market to trade in a range for 2010 with the highs in the 1250 area and lows in the 900 level.
Selecting the right sectors and stock picking will become more important to your success. Look to buy on dips in the market to important support levels. Then add down side protection at interim high points using trailing stops and protective put options to help improve the overall return. Covered calls options will also work well when the market is not rising as rapidly as the last nine months.
Given this analysis of the S&P 500 trend line charts, it is important to position your portfolio for a market that is more likely to trend in a range with cyclical rallies and pullbacks.
The charts of the S&P 500 trend lines provide a good way for investors to align their portfolios with the overall market trends. Picking the right sectors and stocks will become even more important. Look to buy on dips in the price of the S&P 500 trend charts on the next pull back. Be sure to use proper capital management techniques including trailing stops, protective put, covered call options, and position sizing. On any pull back I will add to long positions with stocks and ETFs from the sectors that are likely to outperform the overall market. Keep in mind, Warren Buffett's first rule of investing is, do not lose money. Be patient waiting for good entry points.
By Hans Wagner
tradingonlinemarkets.com
My Name is Hans Wagner and as a long time investor, I was fortunate to retire at 55. I believe you can employ simple investment principles to find and evaluate companies before committing one's hard earned money. Recently, after my children and their friends graduated from college, I found my self helping them to learn about the stock market and investing in stocks. As a result I created a website that provides a growing set of information on many investing topics along with sample portfolios that consistently beat the market at http://www.tradingonlinemarkets.com/
Copyright © 2010 Hans Wagner
If you wish to learn more on evaluating the market cycles, I suggest you read:
Ahead of the Curve: A Commonsense Guide to Forecasting Business and Market Cycles by Joe Ellis is an excellent book on how to predict macro moves of the market.
Unexpected Returns: Understanding Secular Stock Market Cycles by Ed Easterling. One of the best, easy-to-read, study of stock market cycles of which I know.
The Disciplined Trader: Developing Winning Attitudes by Mark Douglas. Controlling ones attitudes and emotions are crucial if you are to be a successful trader.
Hans Wagner Archive |
© 2005-2022 http://www.MarketOracle.co.uk - The Market Oracle is a FREE Daily Financial Markets Analysis & Forecasting online publication.