Gold, Silver, Crude Oil and Natural Gas Mid-Week Technical Trading Charts
Stock-Markets / Financial Markets 2010 Mar 11, 2010 - 01:49 PM GMTBy: Chris_Vermeulen
 So far this week has been pretty slow. Large cap stocks continue to lag the market which can be observed by looking at the Dow Jones Industrial Average which still has room to move higher before breaking the January high.
One important thing to note is that volume has picked up this week considerably – particularly on the SP500 and OEX. It’s difficult to say if this volume is a good sign or not.
A lot of stocks and sectors are trading near their January high and this gives traders a reason to unload shares. On the flip side, the several sectors and indexes have broken their January high and this triggers a surge in volume as breakout traders try to take advantage of the new high and momentum. So you can see how the surge of volume is not a useful indicator right now.
Here are some charts of what I think we could see in the coming weeks.
US Dollar Index – Daily Trading Chart
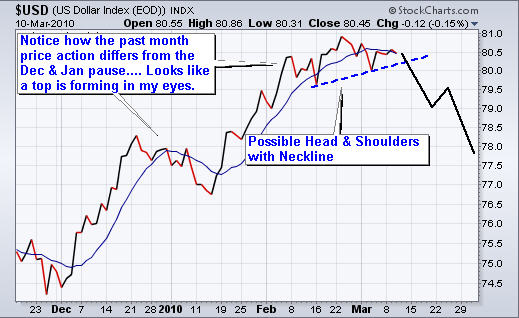
I follow the US dollar index very closely simply because it affects the prices of stocks and commodities. I used a line chart below in order to take out the daily candle stick noise which made it very difficult for our eyes to pick up this pattern.
The chart shows a possible head & shoulders pattern and if that is the case then we should see the dollar start to slide lower. In turn, this would boost stocks and commodities. This is the fuel that I think could really move the market sharply higher in the coming weeks.
GLD Gold ETF – Daily Trading Chart
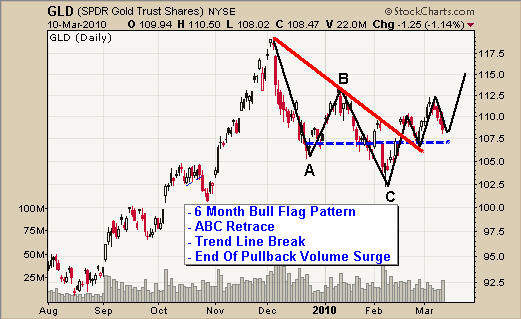
The price of gold looks to be setup for a nice bounce off support and the timing could just work out if the US Dollar starts to drop over the next few days. There could be a low risk setup just around the corner.
SLV Silver ETF – Daily Trading Chart
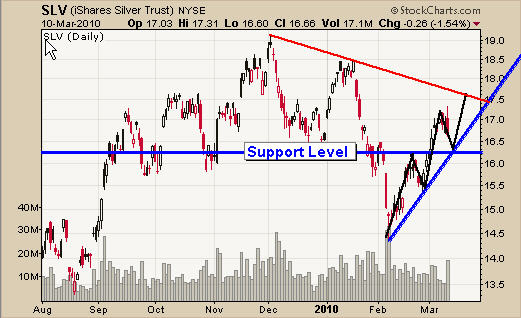
Silver has held up well but today’s reversal candle to the downside scares me a little. The odds are that silver will carry this strong momentum selling down for another 1-2 days. Again, with any luck, it will test support and the US Dollar will start to slide lower.
Crude Oil – Daily Trading Chart
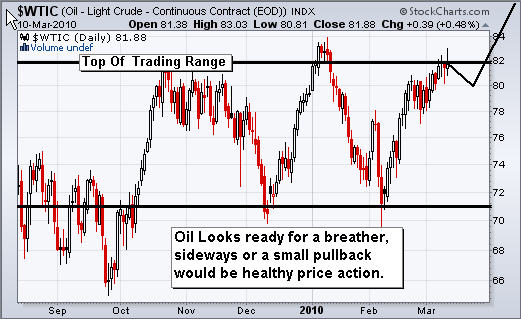
Oil has had a great run the past month but as you can see it’s currently trading at the top of a large trading range. I would like to see a sideways move before it takes another run at the $84 level, but the 7 day bull flag that formed two weeks ago may have been enough to maintain the upward momentum. Again, if the Dollar drops we will see oil rally.
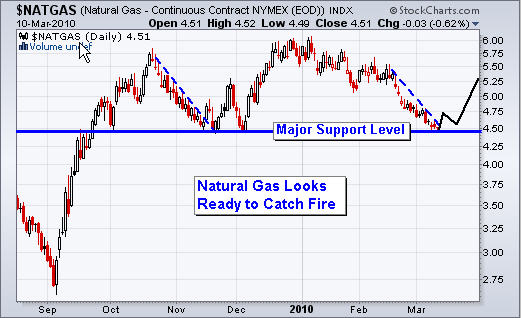
Natural Gas – Daily Trading Chart
This chart is actually very attractive looking. Even if you do not understand how to read charts I think it’s safe to say this one is a no brainer.
I will be closely watching for a potential low risk setup in the coming days.
Mid-Week Trading Conclusion:
In short, stocks and indexes are trading at resistance levels with many of them making new highs and that is great to see.
A lot of things are trading in limbo waiting to see what the US Dollar is going to do. Several months ago I posted some charts showing that 81 would be a key resistance level for the dollar. If it broke above that then 84 would be the next key level to watch. So we just have to wait and see… the hardest part of trading is the waiting.
Gold, silver, oil and natural gas all look like they could continue higher in the next few days if things unfold that quickly. But the market always finds a way to drag out moves so we could still be a 2-3 weeks away.
I hope this report helps give you an idea of where things are at in the market.
If you would like to receive my free weekly trading reports please visit TheGoldAndOilGuy at: www.TheTechnicalTraders.com
Hello, I'm Chris Vermeulen founder of TheGoldAndOilGuy and NOW is YOUR Opportunity to start trading GOLD, SILVER & OIL for BIG PROFITS. Let me help you get started.
To Your Financial Success,
By Chris Vermeulen
Chris@TheGoldAndOilGuy.com
Please visit my website for more information. http://www.TheGoldAndOilGuy.com
Chris Vermeulen is Founder of the popular trading site TheGoldAndOilGuy.com. There he shares his highly successful, low-risk trading method. For 6 years Chris has been a leader in teaching others to skillfully trade in gold, oil, and silver in both bull and bear markets. Subscribers to his service depend on Chris' uniquely consistent investment opportunities that carry exceptionally low risk and high return.
This article is intended solely for information purposes. The opinions are those of the author only. Please conduct further research and consult your financial advisor before making any investment/trading decision. No responsibility can be accepted for losses that may result as a consequence of trading on the basis of this analysis.
Chris Vermeulen Archive |
© 2005-2022 http://www.MarketOracle.co.uk - The Market Oracle is a FREE Daily Financial Markets Analysis & Forecasting online publication.
Comments
|
malik anas
24 Jun 10, 15:32 |
gold
if gold rates will not came down tomarrow .... it will 100%come down next week.... |


