If You Can't Beat 'Em, Join 'Em, Right?
Stock-Markets / Stock Markets 2010 Mar 07, 2010 - 05:17 PM GMTBy: David_Grandey

 Well before we go and buy stocks BLINDLY based on emotions we need to take a look at the indexes first. Why? Because most stocks trade in tandem with the indexes and success in the market is all about knowing what's happening and likely to happen in the indexes and executing your plan based on that action.
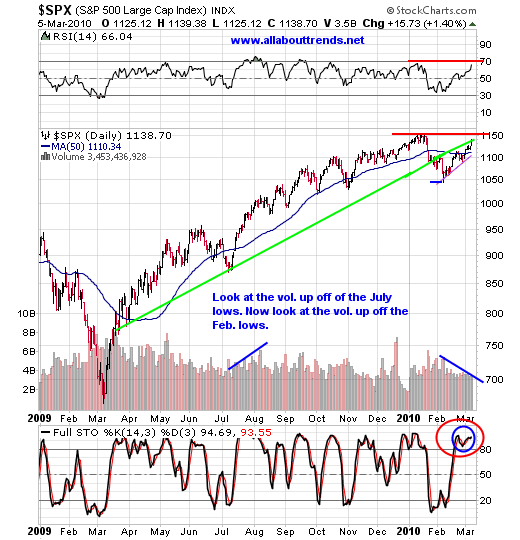
First glances. Near resistance, RSI in the overbought zone, Volume questionable, full stohcastics overbought. And oh, off the March lows we have an Elliot Wave 5-waves pattern showing. This means we either top out right here at a retest of the highs, a marginal new high (RUT showing that right now) or this is the final leg of this rally. Bottom line -- If it looks like a 5-wave duck, quacks like a 5-wave duck, the chances are it's a 5-wave duck.
As far as the chart above goes, it's all about that little pink line, a downside break of it and away we go to the downside, but not until.
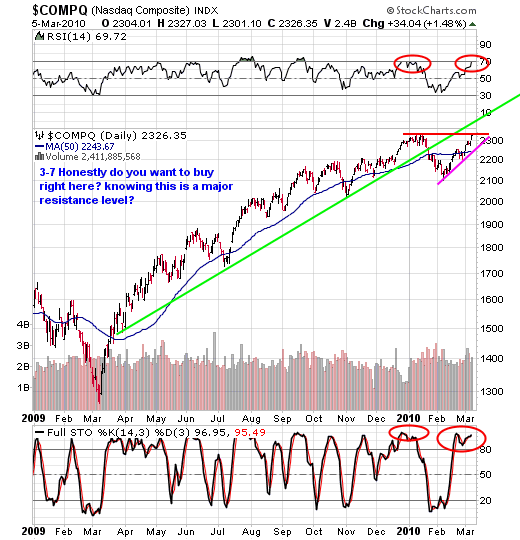
The same goes for the OTC composite, except it had some volume to it. Look at everytime the RSI peeks at or above the 70 level what happens shortly thereafter.
From a daily perspective these two charts say stay away, wait for some sort of a pullback in the indicators at least. Buy the dips and sell the rips and we just ripped as they say.
Moving on to the 60-minute time frequency we see the same things. RSI overbought, full stohcastics overbought and near trend channel resistance vs. support.
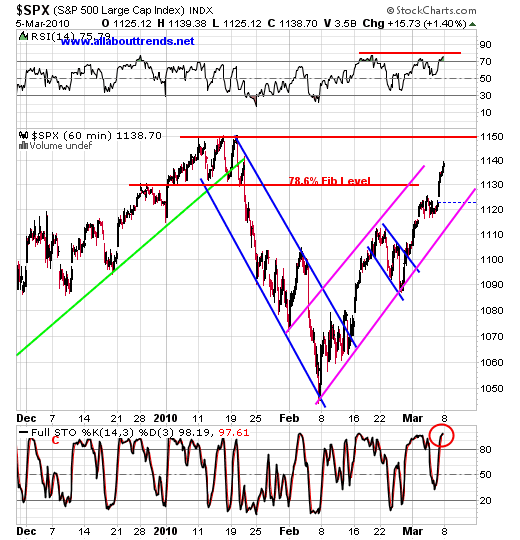
As you can see though this index is just an opening gap away from the 1150 level. The big question is will we test that 1150 level? Or? Or does it even matter. To us it doesn't even matter as we are not buyers at these levels.
We suspect even if we do hit it, it won't initially stick anyway. We need to see some sort of pullback and the RSI and full stohcastics to get oversold to get us interested on the longside and even then it would be hit and run -- get in, get your point or two and run, for us as 1150 is a major resistance level (beware of shake out highs though too).
For you wave fans one could say you've got 3-waves up or 5-waves depending upon how you want to count. Either way super short term that too says if it's a 3? next is wave 4 down (our pullback) And if it's a 5? Then wave 1 down is next (here too our pullback).
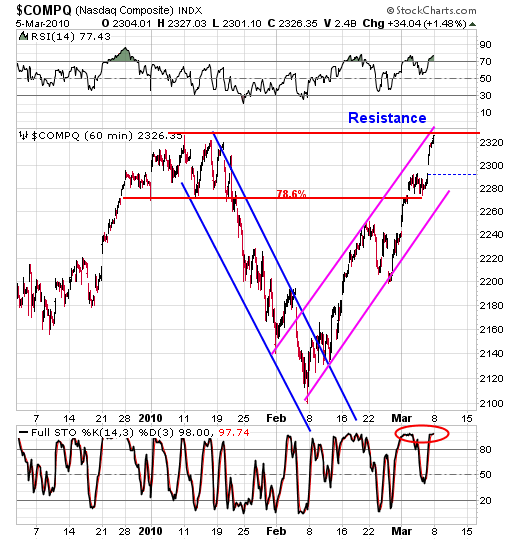
Gosh can you say THERE? Can you say stretched?
So now that we took a look at the index action should we play if you can't beat them join them?
As far as individual stocks are concerned?
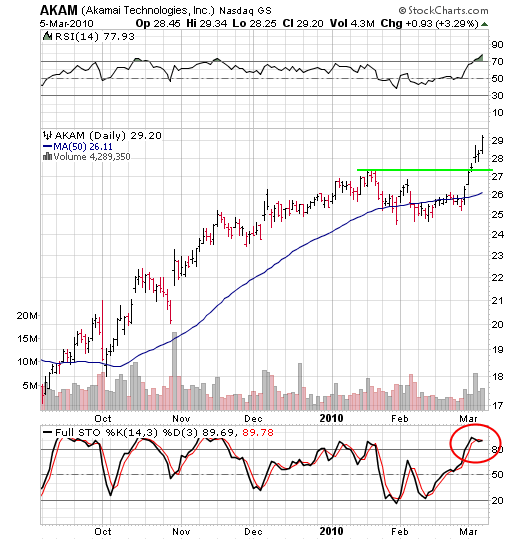
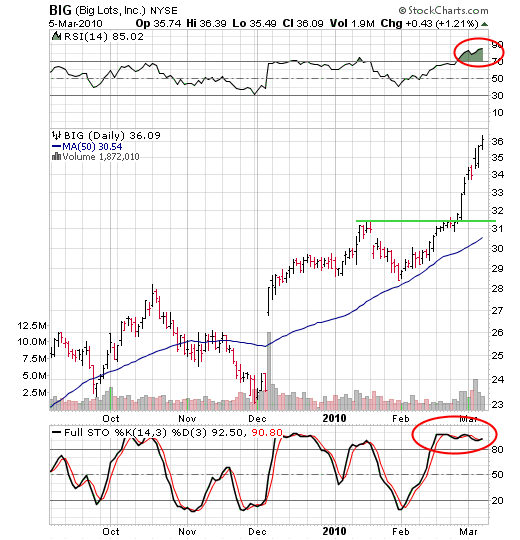
Under the surface though in individual stock land there is no denying that there were some names that just came right up and out into new highs like a rocket in standard blink your eye you missed it form. Some of these names were out of sound bases and others had no basing structure. The bulk of them look like the few charts below.
In Summary:
Retest of highs and pullback to relieve the overbought status or pullback immediately to relieve overbought conditions and perhaps find trend channel support. Then? Another run to retest the highs. If we are going to top it's going to be in that sequence. But don't rule out a shake out high at the least. What's a shake out high? See the Shake and Bake section in our mid-week newsletter for information on that.
Another scenario that could present itself is that sometimes the indexes can chew around for a few days at their highs before moving lower.
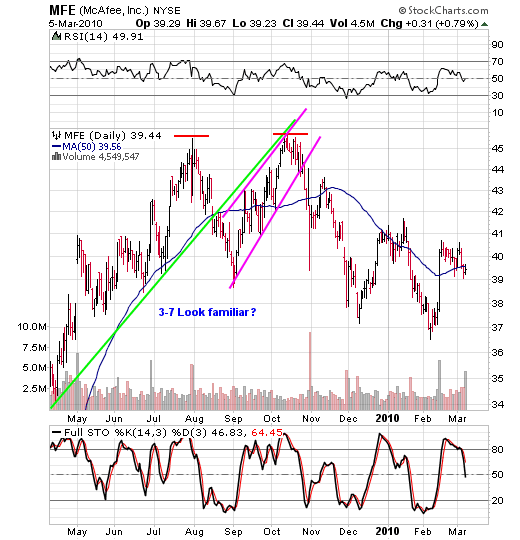
Should the S&P 500 NOT stage a climax run or shake out high when all is said and done, be on the lookout for a chart pattern like McAfee below.
For inverse ETFs that means don't rule out a shake out low of which many are already showing those retests with being a day away from shakeout lows (short term new lows).
So that leads us to the game plan. Due to seeing nothing on the longside from a low risk entry point we will sit back and let the longside come to us in the form of low risk, longside Pullback Off Highs patterns.
By David Grandey
www.allabouttrends.net
To learn more, sign up for our free newsletter and receive our free report -- "How To Outperform 90% Of Wall Street With Just $500 A Week."
David Grandey is the founder of All About Trends, an email newsletter service revealing stocks in ideal set-ups offering potential significant short-term gains. A successful canslim-based stock market investor for the past 10 years, he has worked for Meriwest Credit Union Silicon Valley Bank, helping to establish brand awareness and credibility through feature editorial coverage in leading national and local news media.
© 2010 Copyright David Grandey- All Rights Reserved Disclaimer: The above is a matter of opinion provided for general information purposes only and is not intended as investment advice. Information and analysis above are derived from sources and utilising methods believed to be reliable, but we cannot accept responsibility for any losses you may incur as a result of this analysis. Individuals should consult with their personal financial advisors.
© 2005-2022 http://www.MarketOracle.co.uk - The Market Oracle is a FREE Daily Financial Markets Analysis & Forecasting online publication.


