Stock Market S&P 500 Trend, What a Pump!
Stock-Markets / Stock Markets 2010 Mar 06, 2010 - 08:17 PM GMTBy: Piazzi
 I have not been posting as frequently as last year. That’s partly because of time constraints. It also is because I have been trying to shift my own approach to longer moves. So, I try to lay out a plan for the week, and try to monitor the progress of the plan. If nothing’s going against the plan, there is no need change it. If adjustments are needed or something develops that may put the plan in jeopardy, then I revisit and would definitely post. Don’t get me wrong, I like to post everyday or even more frequently. But, sometimes, other pressing issues steal the time :-)
I also would like you, my reader, to know every tool that I use and the way I use them. I like you to be able to do the same analysis as I do if you think my analysis is worthy of consideration. That is the true and single key to freedom – doing your own work and making your own mistakes – freedom from bubble visions and bubble heads.
Last weekend, I pointed to a host of buy signals on price and breadth, and said
“The short of it is that bulls have all the technicals lined up. Bears, well, I don’t know what they have.
Now, if all the technicals that bulls have lined up fail to deliver, and technicals roll over, and support fails to hold, then, we can interpret that as a change in inherent characteristics of the market and its price action.”
And
“Bears, if they are serious and have enough capital and conviction to make a difference, should break 1080 as a start and then take the index below 1061.”
That was basically all we needed to go by for the week. We had to monitor to see if technicals that bulls had lined up would fail – which they did not – and we had to monitor if bears could do anything bearish – which they could not.
Later on, with index around 1118 or so, I raised my level of concern from 1060 to 1080 and said
“as long as index is above 1080, it is either consolidating or rallying”
So far so good, eh?
No need to micromanage if market is following a trend nicely!
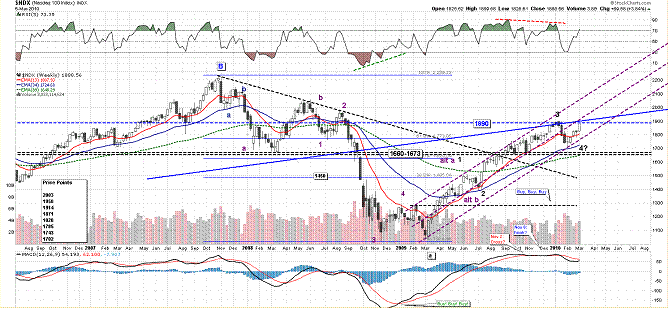
This is a weekly chart of the index
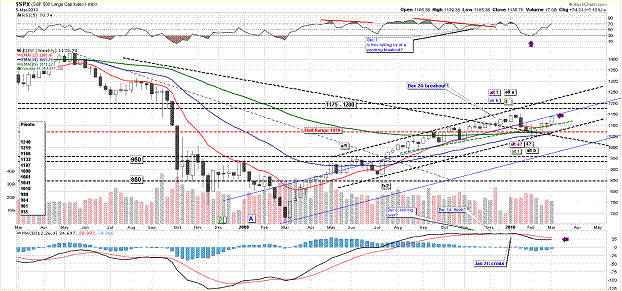
Last week I said this about the weekly chart
“the lows of July and Feb form a picture perfect channel (dashed black) around price action, with an actionary median line from November low (thin blue line)”
Now, weekly price is hitting against the mid-line of the channel. It will be very good for the bulls to get in the upper half of the channel and stay there. It is even more important for them to stay in the channel so that no correction gets below the lower boundary.
Notice that 13 EMAs is nicely rounded. Also, notice that other MAs are flattish and not falling. There is a lot of technical support from MAs and the half-range marker that should contain any correction. If these things fail, then maybe bulls have a problem, but as long as longer term technical profile is positive, it is a bull’s world – but it would be nothing without a bear :-)
I shall keep an eye on MACD for a cross, a failure to cross, especially if it does a kiss or hook may warn us to a correction, but even if so, as long as support holds, and as long as price stays in the weekly channel, it’s just a correction within an uptrending market.
This is daily chart of the index
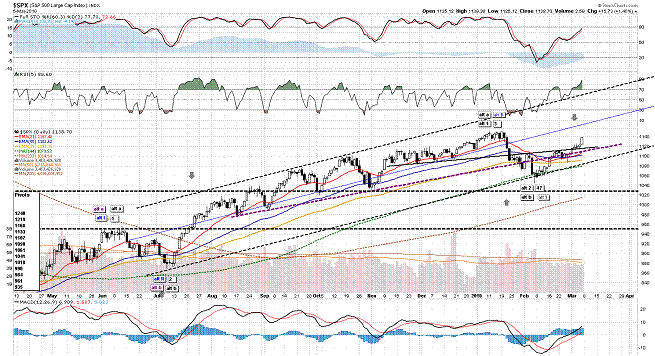
The above chart tells me how useful simple technical analysis can be. Look the two small trend lines that I have had on the chart for quite sometime, one in dashed purple the other in solid black. Notice how price rose towards them as they were converging. Notice how market printed a series of three Dojis above the black line on Tuesday, Wednesday, and Thursday – not violating the line or MAs below it. And, notice the Friday’s candle. No fancy indicators. No complicated technical schema, just two lines and a bunch of MAs.
I would also like you to notice that the channel I have on the daily chart forms a somewhat different envelop around the price than the on the weekly chart. That is because daily closes and weekly closes form different high/low points
The volume has been absent in the 6 up days that we have had in a row. I am sure many bears will point that out. And, yes, it is a something that should be kept in view as a point of concern. But we trade prices and not volume. Have you ever heard a stop point or profit target based on volume? If I am suspicious of a trend for whatever, reason I can stand aside and wait for it to turn. I see no need to jump in front of it and try to turn it around all by myself.
What some bearish blogs that I visit do not mention is that volume of Nas100 has in fact been good
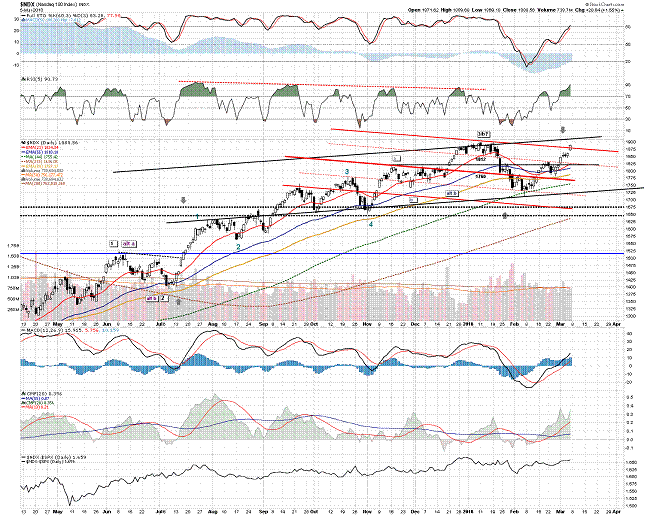
NDX has also been outperforming S&P since Feb low. It is only a few points away from making a new high.
RUT has a new high
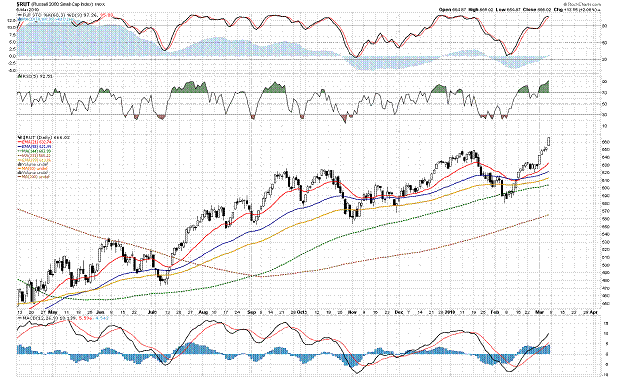
Now, I am not sure how S&P (or the DOW) would collapse in a wave 3 of 3 of 3 of whatever it is uber bears dream while high-beta indexes run like that. Market, as of now, is not exhibiting any signs of weakness. Maybe a crash out of nowhere happens, maybe the world ends, maybe so many things, but, in a game of probabilities, even if we are close, or at another top, I would like to see some signs of weakness first. Bears, if they are serious, better start with a series of lower highs and lower lows.
That being said, NDX is coming against some longer term levels of resistance as you can from this weekly chart
This is another daily chart of NDX with the purple channel blue line of the weekly.
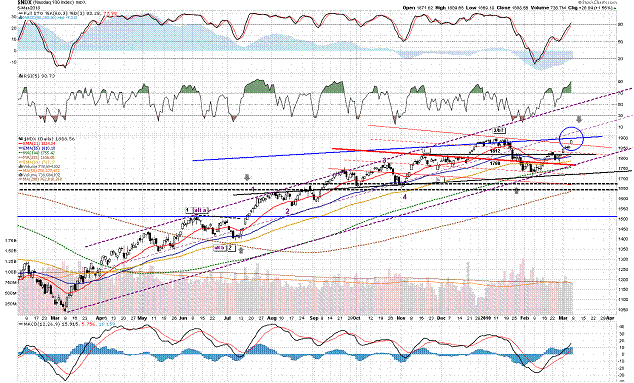
Index is overbought and near resistance. In situations like now, it is very hard to tell someone who is out and bullish, or someone who is bearish and caught with a losing hand what to do. The short guy may cover only to see the market dropping 3-4-5% if not more. He may hold and see in horror how overbought can get even more overbought in a momentum-driven rising market. The bullish guy may buy only to see market correct, or wait outside and see market rise.
On the other hand, if I had a long position from lower levels, then I could start looking at my stops, and position size with respect to my holdings and decide if adjustments were needed. If I wanted to establish a new short, I could define a plan with both entry and exit criteria, and wait for a sell signal of my choice.
This is 60-min chart of S&P
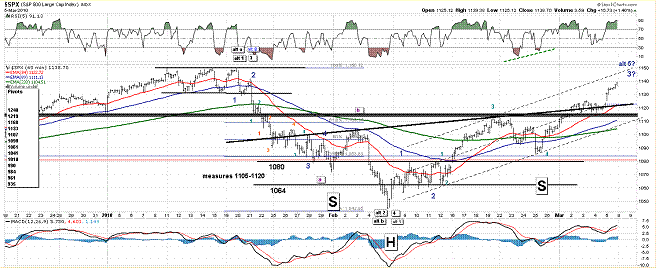
It was only a few days ago that I mentioned a nicely formed channel on the 60-min frame, and said that it was something to keep an eye on, and that bulls needed to keep the price in channel and send it to the upper half. Well, bulls did just that. It was only a short while before the channel that I laid down a range on the chart with two targets. Both targets have been achieved. Now, I am going to raise my level of concern up from 1080. As long as index stays above 1110, it’s either consolidating or rallying.
The choppiness of the Feb 9-13 makes the short term count a bit tricky. It is possible to count it with a wave extension. Friday’s highly momentous price action suggests that we may indeed have an extension. If so, the current wave is a wave 3 (I am counting as a minor degree (dark blue) for now) to be followed by a wave 4 and a wave 5.
For the bears, yes, it is possible to count the rise from Feb low as an ABC, with the C wave ongoing, but that possibility is looking rather faint right now.
A couple of days ago, I mentioned a potential Inv H&S on the 60-min chart. So far, it’s been working as you can plainly see from the above chart.
Bottom line of the matter is that it would take a spectacular reversal of fortune (or liquidity) to start the uber bears’ nightmare of collapse of DOW to 1000 or whatever from right this moment. Anything is possible, but not all things have the same probability of occurring. If history is any guide, positive technical profile like we have now, and momentum like market displayed on Friday, should take some more time to work itself off.
Bears talk a good show, but talking does not crash a market. It takes an absence of buyers followed by ardent sellers. What we have been seeing is a broad existence of buyers and a continuous squeezing of sellers. Index is overbought. It may (emphasize may) pullback any moment. When it does, we’ll see how good bears are with their actions
Support is 1133, and 1107. Resistance is 1168 and 1219.
Long term trend is up. Mid-term trend is up. Short term trend is up.
Have a Nice Week!
By Piazzi
http://markettime.blogspot.com/
I am a self taught market participant with more than 12 years of managing my own money. My main approach is to study macro level conditions affecting the markets, and then use technical analysis to either find opportunities or stay out of trouble. Staying out of trouble (a.k.a Loss) is more important to me than making profits. In addition to my self studies of the markets, I have studied Objective Elliott Wave (OEW) under tutorship of Tony Caldaro.
© 2010 Copyright Piazzi - All Rights Reserved Disclaimer: The above is a matter of opinion provided for general information purposes only and is not intended as investment advice. Information and analysis above are derived from sources and utilising methods believed to be reliable, but we cannot accept responsibility for any losses you may incur as a result of this analysis. Individuals should consult with their personal financial advisors.
© 2005-2022 http://www.MarketOracle.co.uk - The Market Oracle is a FREE Daily Financial Markets Analysis & Forecasting online publication.


