Stock Market Post Crash Peak Price Recovery Time
Stock-Markets / Stock Markets 2010 Mar 06, 2010 - 02:30 PM GMTBy: Richard_Shaw
 Recovery time is a basic concept that we all understand in terms of being out of breath with a rapid pulse after a hard run (for the young), or a trip upstairs for some of us with a few more years of age. The greater the severity of the physical stress and the more prolonged the depletion of short-term reserves, the longer the required recovery time. The better condition we are going into hard work, the shorter our recovery time. Perhaps there a similar kinds of effects in the stock markets.
After a hard crash, it takes some time to recover. The more prolonged the initial crash, the more time it may take to recover. Recovery is a matter of both the economy and companies rebuilding strength, and of the investing community rebuilding faith and perhaps cash reserves. Recovery is also a matter of the financial condition of the economy and companies, and stock valuation levels, prior to a crash.
How hard was the stress on the down side? How prolonged was the stress? What kind of shape was the economy in and the market valuation in before the stress? What may that imply about required recovery time?
Those are important questions for you to ponder.
In any event, let’s consider some significant down markets and the approximate time it took for the market to retake the price of the prior peak.
- 1968 peak: 3+ years to recovery
- 1973 peak: 7+ years to recovery
- 1980 peak: 2 years to recovery
- 1987 peak: 2 years to recovery
- 2000 peak: 7 years to recovery
- 2007 peak: ??? (2+ years so far — 3 years in October).
We have often heard analysts comparing the decline after 2007 to the decline after 1973, which took seven years to recovery. The 2000 crash also took seven years to recovery, but the entire world was not in such hot water as it is today.
The 2007 crash was every bit as hard as the 1973 and 2000 crashes, so maybe it will require something closer to seven years than two. On the other hand, it was swift, as in 1987, which only needed two years to recover. And on the other other hand (if only we had three hands), none of the listed prior down markets were as global as the one we have experienced this time around.
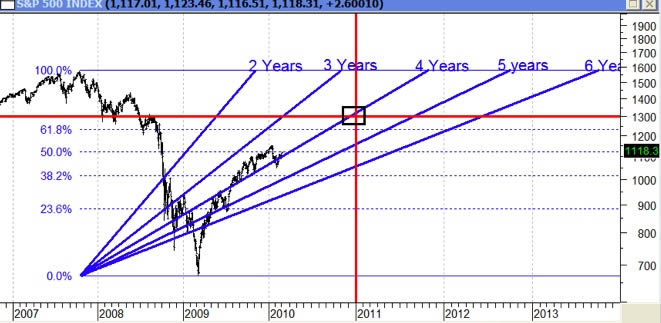
The current path of market price recovery is at the 4-year rate. If the recovery will take more than 4 years, then the recovery rate will have to moderate (decline and then rise; or rise at a lower angle of incline).
At the moment, the recovery is essentially intermediate between the fast recoveries of 1980 and 1987; and the slow recoveries of 1973 and 2000.

The chart above plots trend lines that would lead to recovery to the 2007 peak price level over 2, 3, 4, 5, and 6 years. The red cross hairs with the black box at their intersection, represents the common view among many sell-side analysts that the s&P 500 will close the year around 1300.
We ask whether it is reasonable to assume that the recent crash and current global conditions warrant a faster recovery than after 1973 and 2000. We don’t think it should, but markets are not constrained by “should”, although it is helpful to have the “should” in mind.
In the end, markets do what they do and not what analytic projection says they should do. What do you think the S&P 500 should do based on comparison to prior situations? What do you think it will do?
Holdings Disclosure:
As of March 3, 2010, we do not have current positions in any securities discussed in this document in any managed account.
By Richard Shaw
http://www.qvmgroup.com
Richard Shaw leads the QVM team as President of QVM Group. Richard has extensive investment industry experience including serving on the board of directors of two large investment management companies, including Aberdeen Asset Management (listed London Stock Exchange) and as a charter investor and director of Lending Tree ( download short professional profile ). He provides portfolio design and management services to individual and corporate clients. He also edits the QVM investment blog. His writings are generally republished by SeekingAlpha and Reuters and are linked to sites such as Kiplinger and Yahoo Finance and other sites. He is a 1970 graduate of Dartmouth College.
Copyright 2006-2010 by QVM Group LLC All rights reserved.
Disclaimer: The above is a matter of opinion and is not intended as investment advice. Information and analysis above are derived from sources and utilizing methods believed reliable, but we cannot accept responsibility for any trading losses you may incur as a result of this analysis. Do your own due diligence.
Richard Shaw Archive |
© 2005-2022 http://www.MarketOracle.co.uk - The Market Oracle is a FREE Daily Financial Markets Analysis & Forecasting online publication.


