Gold Stocks Analysis and its Usefulness For Precious Metals Investors
Commodities / Gold and Silver 2010 Mar 05, 2010 - 05:39 PM GMT In our previous essays we have covered the situation on the USD, gold and silver markets, but since there's more to the precious metals sector than just these two metals, we have decided to supplement the previous analysis by covering the precious metals stocks. If you are interested in trading gold and silver only, you might want to reconsider before clicking that X in your web browser's window - after all, precious metals stocks are highly correlated with the metals, and they even used to lead the metals in the past. Consequently, even if you are not interested in trading or investing in the PM stocks, you might still benefit by analyzing this part of the sector.
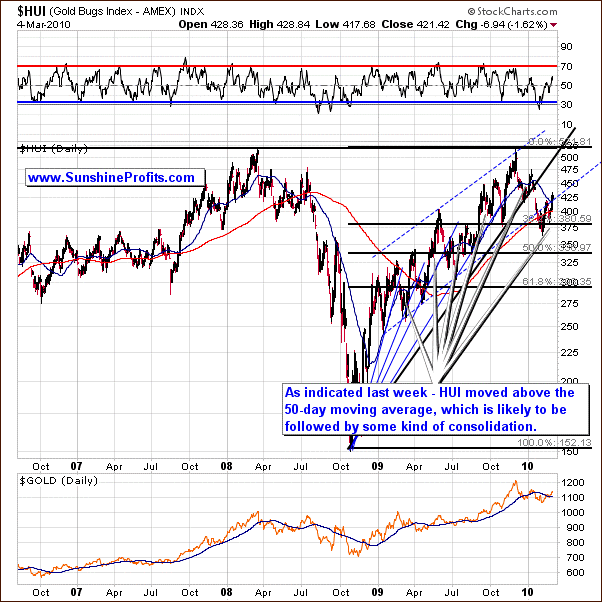
Let's begin commenting on the precious metals stocks, by analyzing the long-term chart of the HUI Index (charts courtesy of http://stockcharts.com.)

Two weeks ago we wrote the following:
The analysis of the long-term HUI chart suggests that gold stocks may need to move a little higher before forming a temporary top. In the past, local tops have been formed after HUI Index moved above the 50-day moving average, which hasn't been the case yet.
During the past several days, HUI Index has in fact moved above the 50-day moving average, which meant that one might expect a local top to be reached rather sooner than later. This was also one of the factors that we took into account before we decided to send out the Market Alert on Wednesday.
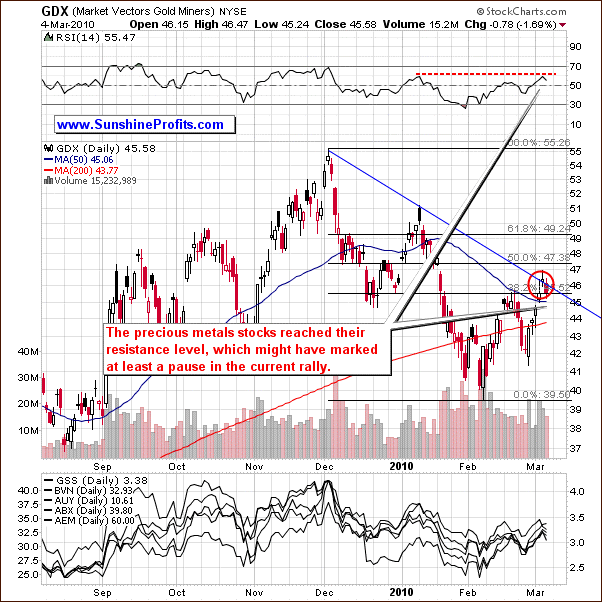
Moreover, the situation on the short-term chart suggests that a short-term resistance level has been reached.

Not only did the value of the GDX ETF move to the declining resistance level (blue line), but it also failed to confirm the breakout above the 38.2% Fibonacci retracement level (black horizontal line near 45.5.)
One of the ways in which a breakout can be confirmed is that the price breaks above a given level and then manages to stay there for at least three consecutive days. This has not been the case here so far. Additionally, the RSI indicator is near the 60 level and the last time that this was the case, we have seen a temporary top - in early January.
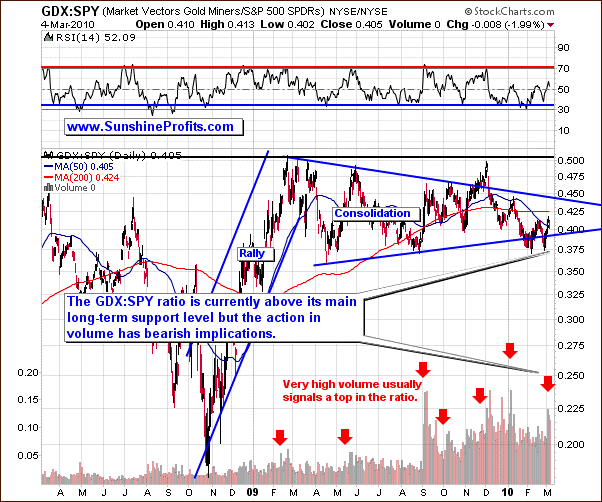
One of our unique indicators from the Premium Charts section is also suggesting that we are near a turning point, and so does the GDX:SPY ratio.

The GDX:SPY ratio measures the outperformance of PM stocks relative to other stocks. We have also featured the above chart in the December 4th 2009 Premium Update. Back then we wrote the following:
In the past the GDX:SPY ratio topped on a relatively high volume, and this is also what we have just seen. (...) The top in the above ratio is very likely to correspond to top in the PM stocks, and also to the top in the metals.
In the following days/weeks the value of the GDX:SPY ratio declined significantly along with prices of gold, silver and precious metals stocks. The high volume in this ratio has also accompanied the local top in the early January, and this is also what we have seen right now. Therefore, keeping a speculative (!) long position in the PM sector at this point does not seem to be a profitable decision.
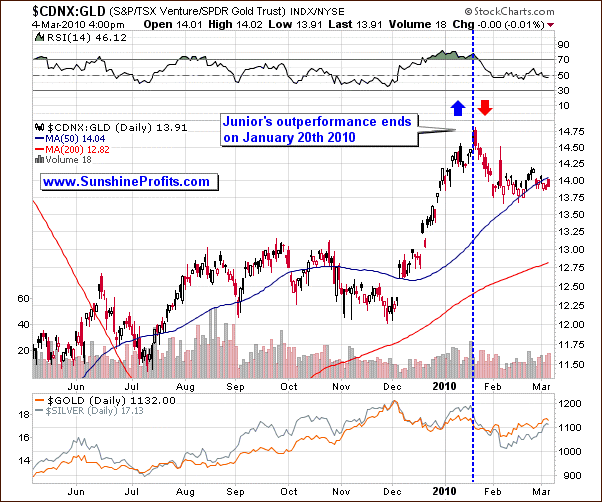
Another part of the PM stock sector is created by the junior mining companies. As far as juiors are concerned - and as we explained in the January 15th Premium Update - we currently don't recommend owning juniors with a large part of your capital because of their very high correlation with the general stock market and the bearish situation on the latter.
Back then we wrote that if you are risk averse, switching from juniors into physical gold/silver, seems to be a good idea, which turned out to be a good call.

The value of the GDNX:GLD ratio has moved lower since the mid-January. CDNX (the Toronto Stock Exchange Venture index) is commonly used as a proxy for juniors. It consists of about 500 largest stocks listed on that particular exchange, most of which are junior mining companies.
The situation has somewhat calmed down meaning that the ratio has been trading sideways in February, but we have not seen any sings that would suggest that it is safe to move into juniors with a large part of one's capital.
Summing up, signals coming from the analysis of the PM stocks' charts currently don't give us very precise signals, which may mean that they are to trade sideways for some time instead of making a sharp move in any direction, but there are other signals, such as the one included in this week's free commentary that suggest that we may be near a local top.
As far as the target for the decline (if one does materialize) is concerned - it is too early to say. We will keep our Subscribers updated and get back to this topic once we have more information.
To make sure that you are notified once the new features are implemented, and get immediate access to my free thoughts on the market, including information not available publicly, I urge you to sign up for my free e-mail list. Sign up today and you'll also get free, 7-day access to the Premium Sections on my website, including valuable tools and charts dedicated to serious PM Investors and Speculators. It's free and you may unsubscribe at any time.
Thank you for reading. Have a great and profitable week!
P. Radomski
Editor
Sunshine Profits
Interested in increasing your profits in the PM sector? Want to know which stocks to buy? Would you like to improve your risk/reward ratio?
Sunshine Profits provides professional support for precious metals Investors and Traders.
Apart from weekly Premium Updates and quick Market Alerts, members of the Sunshine Profits’ Premium Service gain access to Charts, Tools and Key Principles sections. Click the following link to find out how many benefits this means to you. Naturally, you may browse the sample version and easily sing-up for a free trial to see if the Premium Service meets your expectations.
All essays, research and information found above represent analyses and opinions of Mr. Radomski and Sunshine Profits' associates only. As such, it may prove wrong and be a subject to change without notice. Opinions and analyses were based on data available to authors of respective essays at the time of writing. Although the information provided above is based on careful research and sources that are believed to be accurate, Mr. Radomski and his associates do not guarantee the accuracy or thoroughness of the data or information reported. The opinions published above belong to Mr. Radomski or respective associates and are neither an offer nor a recommendation to purchase or sell securities. Mr. Radomski is not a Registered Securities Advisor. Mr. Radomski does not recommend services, products, business or investment in any company mentioned in any of his essays or reports. Materials published above have been prepared for your private use and their sole purpose is to educate readers about various investments.
By reading Mr. Radomski's essays or reports you fully agree that he will not be held responsible or liable for any decisions you make regarding any information provided in these essays or reports. Investing, trading and speculation in any financial markets may involve high risk of loss. We strongly advise that you consult a certified investment advisor and we encourage you to do your own research before making any investment decision. Mr. Radomski, Sunshine Profits' employees and affiliates as well as members of their families may have a short or long position in any securities, including those mentioned in any of the reports or essays, and may make additional purchases and/or sales of those securities without notice.
Przemyslaw Radomski Archive |
© 2005-2022 http://www.MarketOracle.co.uk - The Market Oracle is a FREE Daily Financial Markets Analysis & Forecasting online publication.


