


Stock Market Danger and Safety Levels, Where Are We Now
Stock-Markets / Stock Markets 2010 Mar 05, 2010 - 09:13 AM GMTBy: Marty_Chenard

Danger/Safety Zones: Danger, risks, fear, safety, greed, confidence and bravery are perceived or emotional components that investors have to deal with.
It was with this in mind that we worked on a model that would show the market's danger and safety levels simultaneously on a graph.
The Danger/Safety Zone chart model ...
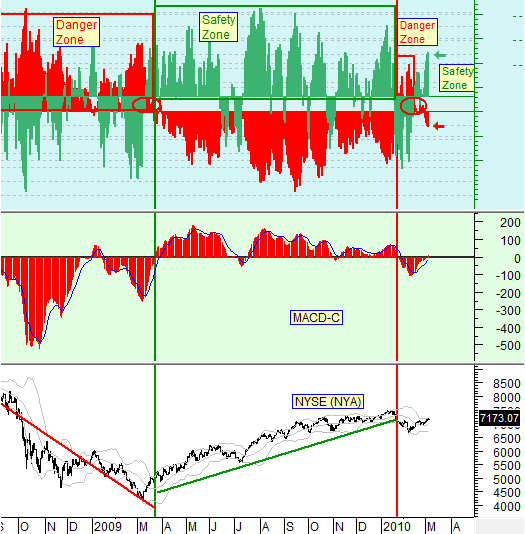
The way this chart works, is that the green bars reflect the safety level, and the red bars reflect the danger level.
The color of the bars above the horizontal line is the predominant condition. The other bar should be below the bottom horizontal line reflecting the diminishing opposite condition. (When a bar level is in between both horizontal lines, it indicates a higher-risk, mixed condition.)
So, what is the model saying today?
It says that we just came out of a Danger Zone condition and now have a Safety Zone condition. That is because the green bars are above the top horizontal line and moving higher, and because the red bars are now below the bottom red horizontal line and moving lower.
*** Comments: So, Safety levels will continue to improve as long as the green bars stay positive and move higher, while the red bars stay negative and move lower.
I would like to see the red bars a lot lower than they are now, but the MACD-C is just starting to turn positive, so a healthy condition would be for the red bars to start moving down faster on their descending process.
[This chart is brought to you as a courtesy today, and is posted daily on our paid subscriber website. In fairness to our subscribers, this chart will only be posted a couple of times per year on this free site.]
** Feel free to share this page with others by using the "Send this Page to a Friend" link below.
By Marty Chenard
http://www.stocktiming.com/
Please Note: We do not issue Buy or Sell timing recommendations on these Free daily update pages . I hope you understand, that in fairness, our Buy/Sell recommendations and advanced market Models are only available to our paid subscribers on a password required basis. Membership information
Marty Chenard is the Author and Teacher of two Seminar Courses on "Advanced Technical Analysis Investing", Mr. Chenard has been investing for over 30 years. In 2001 when the NASDAQ dropped 24.5%, his personal investment performance for the year was a gain of 57.428%. He is an Advanced Stock Market Technical Analyst that has developed his own proprietary analytical tools. As a result, he was out of the market two weeks before the 1987 Crash in the most recent Bear Market he faxed his Members in March 2000 telling them all to SELL. He is an advanced technical analyst and not an investment advisor, nor a securities broker.
Marty Chenard Archive |
© 2005-2022 http://www.MarketOracle.co.uk - The Market Oracle is a FREE Daily Financial Markets Analysis & Forecasting online publication.