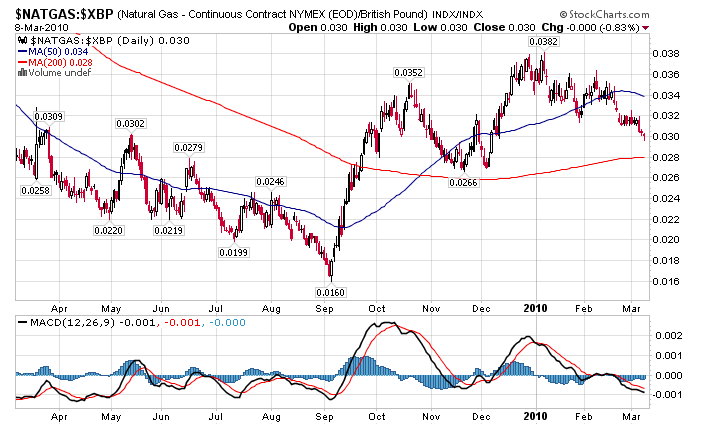
Natural Gas Trumps Gold's Comeback...
Commodities / Natural Gas Mar 04, 2010 - 08:10 AM GMT In our report published November 20th, 2009, we recommended immediate action be taken regarding gold positions in general and in a particularly profitable, zero premium trade in silver that we had prescribed several weeks prior. In the face of a steadily rising bullion price we said the following:
We at Oakshire Financial claim no crystal ball, but we have reason to suspect that the latest bull run in the precious metals – and gold, specifically – has gored its last banderillero. A resumption of the long term, up-move is certainly in the cards for a later date, but we smell an intermediate trend correction now in the making that may last for months.
Here's the way gold – represented here by the SPDR Gold Trust – has looked since then:
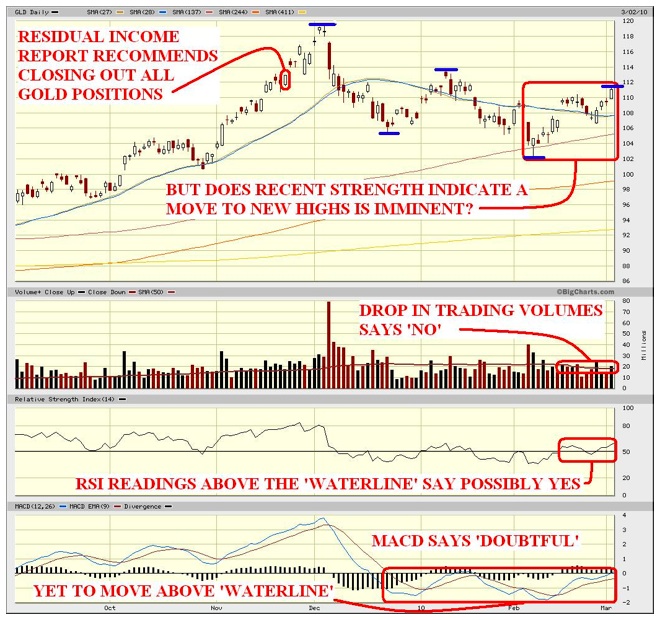
The question now is whether those three months since gold's all-time high mark the end of the retreat, or if we're still in the midst of a downtrend, and the latest strength should be considered a mere counter-trend rally.
According to the rules of technical analysis, lower highs and lower lows (on the chart in blue) are indicative of a downtrend, and until we see a sharp move above the last retracement high at 114, that downtrend is considered in force. Lower trading volumes in the last month and MACD weakness would also corroborate that conclusion.
In short, sit tight. Until further notice, the gold decline is still on.
In Short We Trust!
That also goes for you folks who put on the convertible hedge we recommended with the Coeur D'Alene debenture back at the beginning of November of last year, when Coeur common shares were trading above $21 and your hedge fetched a delicious 10.9% annually. Without getting too detailed, your short sale of CDE at $21 is still profitable and should be held. Coeur is trading today at $15.40 and barely holding last-line support. See here:
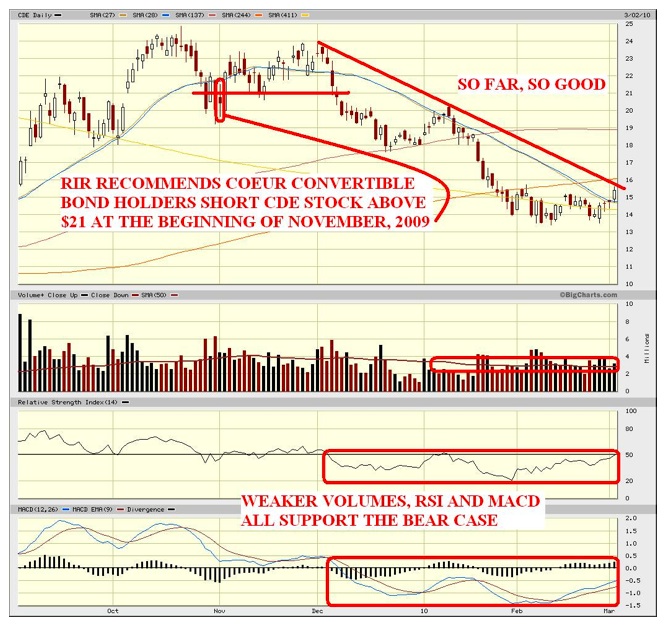
The trade has panned out well, and without belabouring it, we could see more profits in the months ahead. Don't even think of unwinding the trade. All the technicals support weaker CDE prices. And if the long term moving average (in yellow on chart) is ruptured, gang way, friends; the next line of support is in the $10 range.
So what does this mean for the rest of our holdings, and what do we do next?
Glad you asked. Moving forward, there are a number of reasons to believe that the pace of global economic growth will be restrained by both the recent rise in Chinese interest rates and the so-called crisis in Greece (and elsewhere) that will have to be backstopped (at the very least) by loan guarantees from the EU.
Add to this the need for fiscal restraint globally (after massive spending pledges to kick-start a moribund world economy last year) and we can see very little chance of interest rates rising anywhere in the foreseeable future.
That doesn't mean that we'll experience negative growth this year; indeed, year over year we're going to have a doozy of an expansion. The chart below points to mainstream economic projections for the year ahead.
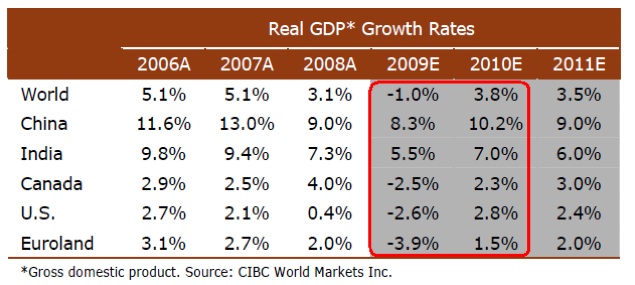
Note well the 2010 rate of growth expected in the U.S. as compared to the prior two years. The American economy is clearly expected to lead the expansion through December.
And with global trade on the rise, we're also likely to see increased output from a manufacturing sector that was forced to curtail operations while a much needed belt-tightening was undertaken over the last eighteen months. Here's a visual that depicts the expansion in trade levels since the recession hit.
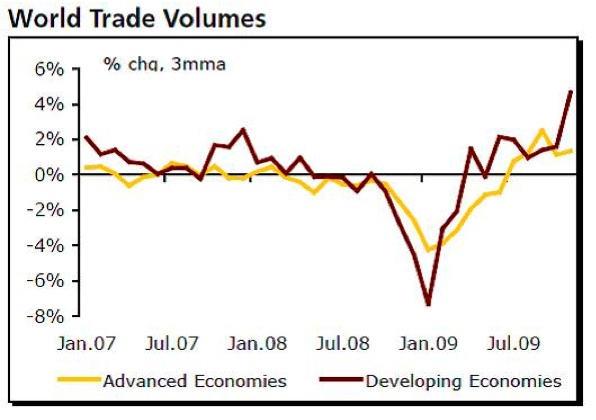
Clearly, we're in an uptick.
The global picture continues to point toward U.S. Treasuries remaining the address of choice for global investors interested in the safety of their principal and a modest return on their investment (more on this in coming issues of the RIR). It also points to a continued bull run in stocks. Remember: the full American stimulus package of $787 billion has yet to find its way into the economy. Only a third of it has actually been spent. In our estimation, that speaks to a healthier consumer, which, in turn, speaks to a healthier U.S. and global manufacturing sector.
The key here is inventory levels. Most manufacturers let stocks deplete throughout the economic crisis, laying off workers and shuttering a good percentage of plant capacity in the process. Those inventories now have to be restored to meet rising global demand. Employment levels should benefit from these nascent increases in production.
Natural Gas Stockpiles also Depleted
Our recommendation this week is a timed trade that's aimed at exploiting two distinct factors outlined above: 1) the expansion we see coming in the year ahead, and 2) an indicator we've been watching closely for well over a year now: natural gas inventories.
For a variety of reasons, including the outrageously cold and snowy winter we experienced this past year, natural gas stocks have been significantly eroded since their peaks in the spring of 2009. For the many who wondered how oil futures could rise so dramatically last year while natural gas prices floundered, here's your answer:
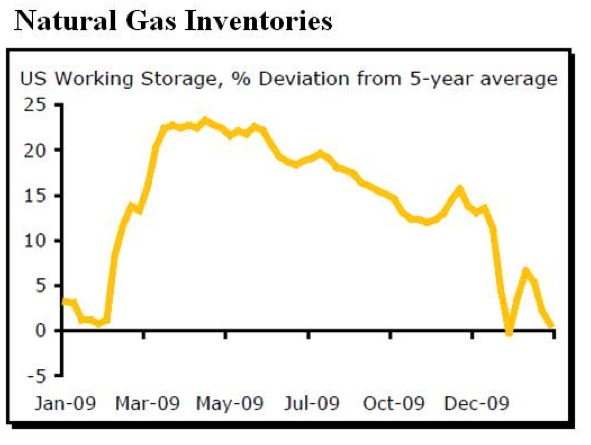
It was simply a matter of oversupply. But with new factories coming onstream and capacity ramping up, gas stocks have dropped considerably.
In short, natural gas prices could be set for a significant increase in the face of any external, unseen supply shocks, or a hotter than normal summer that bolsters generation demand for electricity. And with that backdrop in mind, we come to our trade.
Enbridge, Inc. (NYSE:ENB) operates the world's largest pipeline system, with over 6000 miles of crude and natural gas pipe criss-crossing North America. The company also completed two new projects recently, Alberta Clipper and Southern Lights, which collectively will add nearly one million barrels per day to Enbridge's already dominant delivery system.
Enbridge currently offers a respectable 3.56% annual dividend and is up better than 50% in the last twelve months' trade, but the real play here is on natural gas, whose price should be pressured higher from its current tight stock situation.
Here's a year's worth of Enbridge trading:
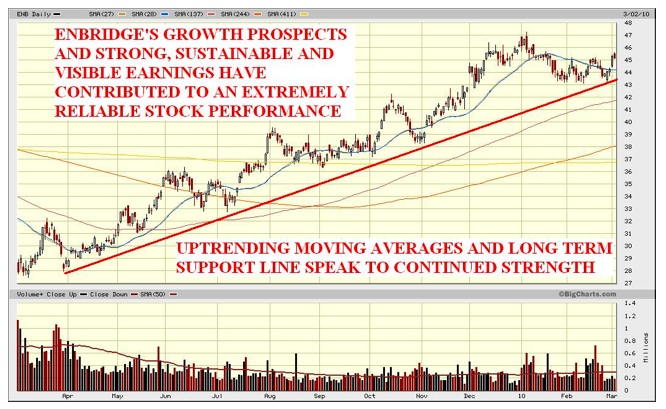
Moreover, Enbridge offers the most visible and sustainable future earnings projections of any of the pipeline majors.
Because it's so natural.
Good investing,
Matt McAbby,
Analyst, Oakshire Financial
Oakshire Financial originally formed as an underground investment club, Oakshire Financial is comprised of a wide variety of Wall Street professionals - from equity analysts to futures floor traders – all independent thinkers and all capital market veterans.
© 2010 Copyright Oakshire Financial - All Rights Reserved
Disclaimer: The above is a matter of opinion provided for general information purposes only and is not intended as investment advice. Information and analysis above are derived from sources and utilising methods believed to be reliable, but we cannot accept responsibility for any losses you may incur as a result of this analysis. Individuals should consult with their personal financial advisors.
Oakshire Financial Archive |
© 2005-2022 http://www.MarketOracle.co.uk - The Market Oracle is a FREE Daily Financial Markets Analysis & Forecasting online publication.


