


Will the Stock Market PE Ratio Expand or Contract?
InvestorEducation / Learning to Invest Aug 07, 2007 - 01:00 PM GMTBy: Hans_Wagner

Knowing whether the PE ratio is going to expand or contract is an important factor when trying to beat the market . This is the first of a four part series on which direction the PE ratio for the S&P 500 will go over the next couple of years. First, let's briefly go over how to use the PE ratio and then we will look at ways to get the underlying PE ratio for the S&P 500. It is not as easy as one might first think. In the later parts we will examine the potential for the S&P 500 PE ratio to expand, contract and then provide an opinion on what investors should do.
An Overview of the PE Ratio
The price-to-earnings PE ratio is very useful to value stocks. It is calculated by taking a company's share price and dividing this by its earnings per share. This ratio provides a measure of the price being paid for the earnings. The higher the PE ratio the more investors are paying for the underlying earnings.
The more growth the company has experienced or is expected to see, the higher the PE ratio will be. On the other hand the PE ratio can also be an indication that the company is overvalued and the price of the company might fall as investors realize the extent of their problems.
A low PE can signal a good time to buy, but it can also mean that the company is having problems. The PE ratio can be very helpful in assessing stocks but it needs to be considered along with other important factors.
The PE chart of a company or index over time can tell us a lot about how risky the investment is or if it's a good time to buy in. When considered with future earnings, forecasts can be made on the future price of the company.
Over time PE ratios grow and contract. This can be caused by the economy or earnings expectations. For example if a company's earnings increase by 30% and the PE ratio remains the same, then the price of the stock should increase by 30% as well. On the other hand, if earnings go up 30% but the PE pulls back 30%, due to lower earning forecasts, you are left with a stock that didn't go anywhere.
Basically the price of a stock can be explained by the growth in earnings and the expansion or contraction of the PE ratio. You can find the PE ratio for a stock on most popular stack sites such as finance.yahoo.com .
PE Ratios for IndexesUnfortunately the PE of an index - the total price of the index divided by its total earnings - is a little more difficult to come upon. To get this information, you have to go to the source - the index's publishers. For example, you can find the PE for the S&P 500 on the Standard & Poor's website and for the DJIA on the Dow Jones Indexes website .
Once there you must search around for the index in question as well as the PE ratio. There are no readily available charts that you can use to evaluate the longer term trends.
Other Sources for the PE Ratio for the S&P 500You can search for PE ratio charts for various indexes on the Web. A brief search gave me the charts below.
The two charts below are from Ticker Sense . The first one shows STP 500 price and PE ratio from 1986 to March 2007. The key observation on the first chart is the fall in the PE ratio as the S&P 500 grew. Usually the PE ratio helps the S&P 500 increase in value by expanding itself. However, keep in mind that the PE ratio was declining from the technology bubble of 2000.
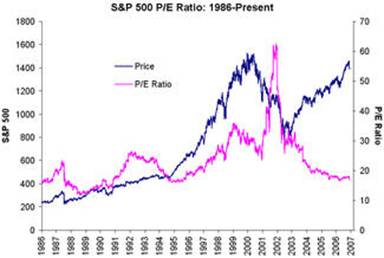
The second chart is for the S&P 500 price and PE ratio from May 2006 to March 2007. Notice the dramatic drop in the price and PE ratio that correspond to the fall in the market that begin at the end of February 2007.

According to various experts the PE ratio has averaged around 15 for the last 100 years. Of course it has moved above and below this level over time.
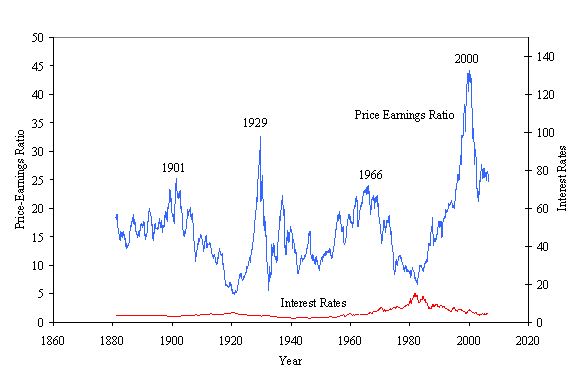
Robert Shiller, author of Irrational Exuberance: Second Edition , uses "real price" and "real earnings" to derive his PE ratio. He has an extensive web site with an excel file of his data that is up dated periodically. The chart below for the S&P 500 PE ratio is from this site. Part of his methodology is to use averages over time to calculate the values. This tends to slow the movement of the PE ratio which partly explains why the chart below shows a higher PE ratio for the S&P 500. Also the latest data is for August 2006.
Another way to get an estimate of the PE ratio use exchange-traded funds (ETF), which closely follows the index. This measure will not be as exact as the index's own measure, due to the fees charged by the ETF. Also the ETF is traded on the market so there will be slight variation in the value as well. However, these should be only slight variation, so the PE ratio should follow very closely to the ratio for the underlying index. The biggest benefit is the information is a lot easier to find.
The table below is for some of the popular index based ETFs.
| Index | ETF | Ticker |
| S&P 500 | SPDRs | SPY |
| DJIA | Diamonds Trust I | DIA |
| NASDAQ 100 | NASDAQ 100 Trust | QQQQ |
| Russell 2000 | iShares Russell 2000 | IWM |
| Wilshire 5000 | Total Stock Market VIPERS | VTI |
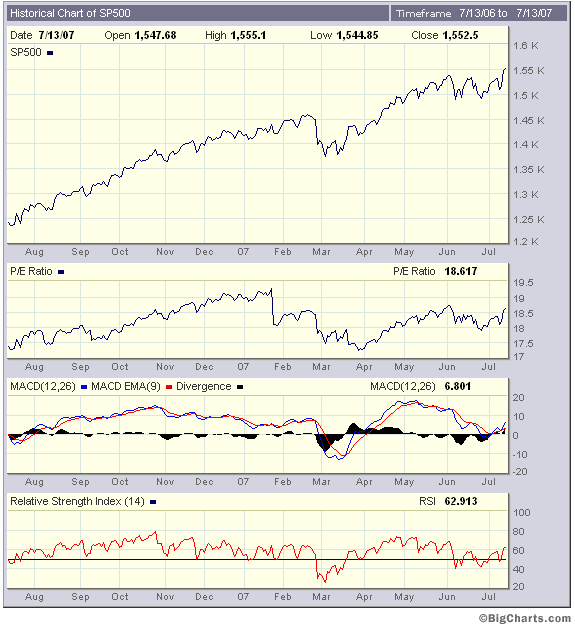
There is a way to get the PE ratio included on one chart tool that is available to anyone with internet access. Go to BigCharts . Enter your symbol in the field at the top left and click on the Interactive Chart button. Under Chart Options adjust the time period you want to see. Then under Lower Indicators chose the PE Ratio. For example this works for the S&P 500 as shown below.
The Bottom Line
In summary the PE ratio is a useful tool to help understand the potential value of a stock or the overall market. It is particularly useful to see the PE ratio displayed over time in chart format. When an investor is trying to decide if the market is fairly valued a chart showing the PE ratio over time is a useful tool. However, it is difficult to find ways to plot the PE ratio over time. This article provided some further background on how to find and the plot the PE ratio for various indexes. As with any tool it should be used in conjunction with others to help make an investment decision.
By Hans Wagner
tradingonlinemarkets.com
My Name is Hans Wagner and as a long time investor, I was fortunate to retire at 55. I believe you can employ simple investment principles to find and evaluate companies before committing one's hard earned money. Recently, after my children and their friends graduated from college, I found my self helping them to learn about the stock market and investing in stocks. As a result I created a website that provides a growing set of information on many investing topics along with sample portfolios that consistently beat the market at http://www.tradingonlinemarkets.com/
Hans Wagner Archive |
© 2005-2022 http://www.MarketOracle.co.uk - The Market Oracle is a FREE Daily Financial Markets Analysis & Forecasting online publication.