Stock Market Short-Term Advance Could Set Up For a Major Top
Stock-Markets / Stock Markets 2010 Feb 28, 2010 - 10:32 AM GMTBy: David_Grandey
 So here we are, still in this B wave up, snapback rally, whatever you want to call it.
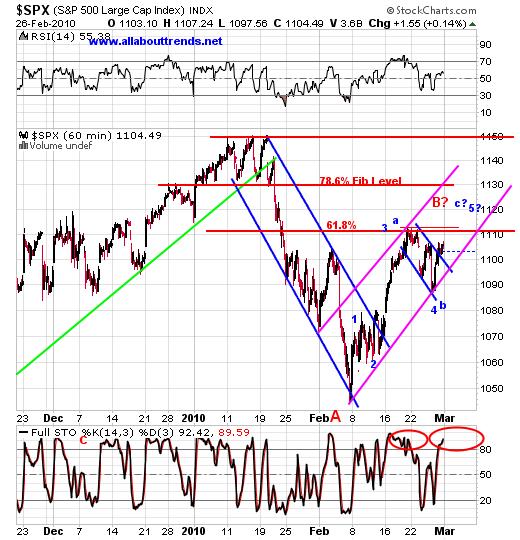
While the Full Stochastics are back to being overbought we have the general structure showing the potential of some more work to do on the upside next week.

A few weeks back we were talking about the 78.6% fib level. The drop off of the 1130 level down was so fast that one could say it's the equivalent of a gap. Lately a lot of gaps have been getting filled and should this one get filled it would not surprise us. In fact we'd prefer it to get filled to get it out of the way if we are going to get a lasting top that is.
The pink uptrend channel is still intact with Friday's action (albeit feebly) marking the start of a potential POH (Pullback Off Highs).
The wave structure whether you want to call it ABC or 12345 makes no difference to us as a potential wave C or 5 as shown in the chart above basically say the same thing. Of course they can truncate too you know (stall and fail).
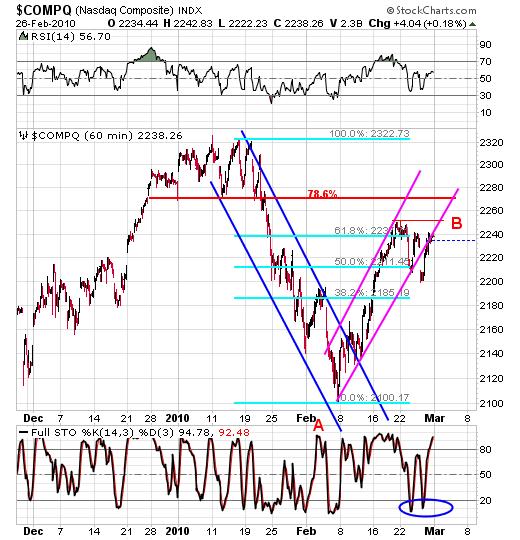
Here is the 60 Minute OTC Comp chart to go along with the S&P 500 for your viewing pleasure.

For those of you who are not familiar with Elliott Wave remember it's all about trends as in trendlines. This is for you:
With the S&P 500, it's all about the Bottom PINK LINE. It's all you need to know. It's still intact and still the order of the day. We will not get any decisive break to the downside or the start of a C wave TILL WE BREAK THIS LINE.This is why it's imperative that we continue to monitor this line.
In Summary:
It's almost as if about the only thing that is going to get this market into gear is a news driven futures related computer program driven pop as manic Monday is upon us. And we all know what happens shortly there after that occurs right? Nothing. One can only imagine what the matrix will cook up.
Should we work higher next week we'll keep looking to add to the short side one step at a time -- a little bit here and a little bit there. It's called courage of conviction based upon chart pattern recognition.
Remember on the way up (while we were in a big picture clearly defined uptrend above the 50 day) the name of the game was to buy the dips and sell the rips, now? Short the rips after the computers pop it and cover the dips may be the flavor of the year.
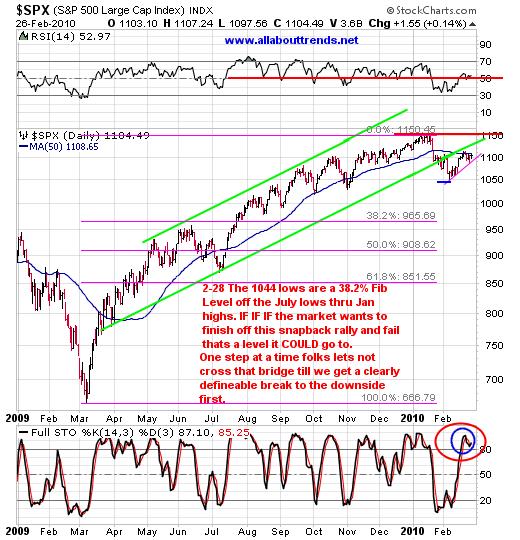
Below is the big picture chart of the S&P 500.

As you can see in the chart above, we are struggling at the 50 day, we have the full stochastics in overbought territory and we are backtesting a clearly defined uptrend line break commonly referred to here as a KODR (Kiss Of Death Retracement). A KODR is a Kiss Of Death Retracement. This is when an issue or index breaks an uptrend to the downside and comes back up to kiss it from underneath and then fails.
By David Grandey
www.allabouttrends.net
To learn more, sign up for our free newsletter and receive our free report -- "How To Outperform 90% Of Wall Street With Just $500 A Week."
David Grandey is the founder of All About Trends, an email newsletter service revealing stocks in ideal set-ups offering potential significant short-term gains. A successful canslim-based stock market investor for the past 10 years, he has worked for Meriwest Credit Union Silicon Valley Bank, helping to establish brand awareness and credibility through feature editorial coverage in leading national and local news media.
© 2010 Copyright David Grandey- All Rights Reserved Disclaimer: The above is a matter of opinion provided for general information purposes only and is not intended as investment advice. Information and analysis above are derived from sources and utilising methods believed to be reliable, but we cannot accept responsibility for any losses you may incur as a result of this analysis. Individuals should consult with their personal financial advisors.
© 2005-2022 http://www.MarketOracle.co.uk - The Market Oracle is a FREE Daily Financial Markets Analysis & Forecasting online publication.


