


Use Bar Chart Patterns To Spot Trade Setups
InvestorEducation / Learn to Trade Feb 26, 2010 - 11:50 AM GMTBy: EWI

 How a 3-in-1 chart formation in cotton foresaw the January selloff
By Nico Isaac
For Elliott Wave International's chief commodity analyst Jeffrey Kennedy, the single most important thing for a trader to have is STYLE-- and no, we're not talking business casual versus sporty chic. Trading "style," as in any of the following: top/bottom picker, strictly technical, cyclical, or pattern watcher.
Jeffrey himself is, and always has been, a "trend" trader; meaning: he uses the Wave Principle as his primary tool, along with a few secondary means of select technical studies. Such as: Bar Patterns. And, of all of those, Jeffrey counts one bar pattern in particular as his absolute, all-time favorite: the 3-in-1.
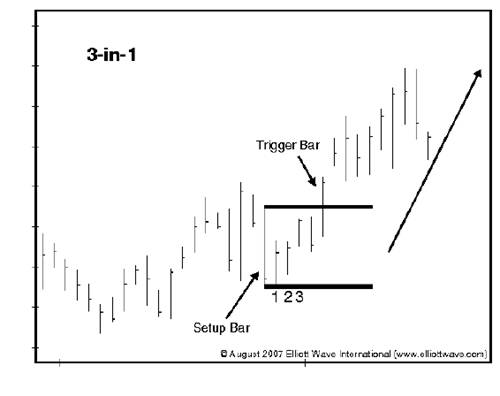
Here's the gist: The 3-in-1 bar pattern occurs when the price range of the fourth bar (named, the "set-up" bar) engulfs the highs and lows of the preceding three bars. When prices move above the high or below the low of the set-up bar, it often signals the resumption of the larger trend. The pouit where this breach occurs is called the "trigger bar." On this, the following diagram offers a clear illustration:
For a real-world example of the 3-1 formation in the recent history of a major commodity market, take a look at this close-up of Cotton from Jeffrey Kennedy's February 5, 2010, Daily Futures Junctures.
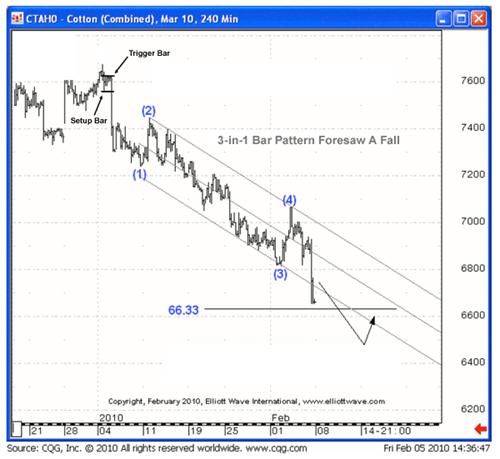
As you can see, a classic 3-in-1 bar pattern emerged in Cotton at the very start of the new year. Then, within days of January, the trigger bar closed below the low of the set-up bar, signaling the market's return to the downside. Immediately after, cotton prices plunged in a powerful selloff to four-month lows.
Then February arrived and with it, the end of cotton's decline. In the same chart, you can see how Jeffrey used the Wave Principle to calculate a potential downside target for the market at 66.33. This area marked the point where Wave (5) equaled wave (1), a common relationship. Since then, a winning streak in cotton has carried prices to new contract highs.
What this example tells you is that by tag-teaming the Wave Principle with Bar Patterns, you can have a higher objective chance of pinning the volatile markets to the ground.
To learn more, read Jeffrey Kennedy's exclusive, free 15-page report titled "How To Use Bar Patterns To Spot Trade Set-ups," where he shows you 6 bar patterns, his personal favorites.Nico Isaac writes for Elliott Wave International, a market forecasting and technical analysis firm.
© 2005-2022 http://www.MarketOracle.co.uk - The Market Oracle is a FREE Daily Financial Markets Analysis & Forecasting online publication.