


Bull Market Geniuses, Did You Sell GLD, GDX, SLV?
Commodities / Gold and Silver 2010 Feb 25, 2010 - 02:33 AM GMTBy: Guy_Lerner

 Ok, this one is for all you bull market geniuses out there who have been buying the SPDR Gold Trust (symbol: GLD), the Market Vectors Gold Miners ETF (symbol: GDX), and the i-Shares Silver Trust (symbol: SLV) all the way down and since they peaked in mid January.
Let me remind you that the last time we visited GLD, GDX, and SLV it was on January 20, 2010 when I stated that "it is my expectation that precious metals will be under pressure." So let's revisit those ETF's, and see where we stand a month later.
Figure 1 is a daily chart of the SPDR Gold Trust (symbol: GLD). The indicator in the lower panel is the on balance volume (OBV) indicator with a 40 period simple moving average. The red dots on the price bars are "super" pivots - another new that I have developed to delineate the best areas of buying and selling or support and resistance. On the GLD, I put red arrows over the January 20th price bar and the price bar inside the gray oval is from January 11 when I actually issued a sell signal on GLD.
Figure 1. GLD/ daily
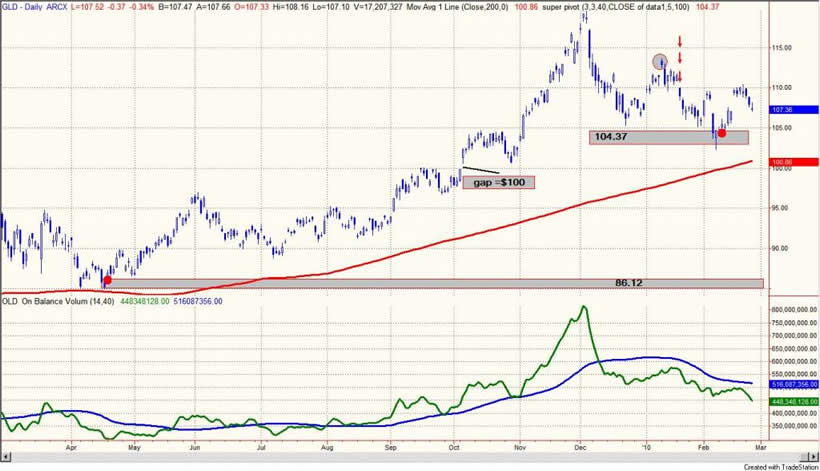
The first thing we notice is that GLD remains above support at 104.37. The second thing to notice is the OBV indicator is leading price lower. One would think that support will be tested; a break below this level implies the breakout and gap at $100 being filled.
Figure 2 is a daily chart of the Market Vectors Gold Miners (symbol: GDX). The red arrows identify the January 20th price bar. The horizontal red lines are our important levels of support and resistance. Price is back below support, which is now resistance. The next level of support is at 34.64. The OBV is leading price lower, and the OBV moving average has rolled over as well. While points 1 and 2 on the chart were similar set ups to the current situation -i.e., a break below support and then a thrust higher - there is one difference in that prices are below their 200 day moving average.
Figure 2. GDX/ daily
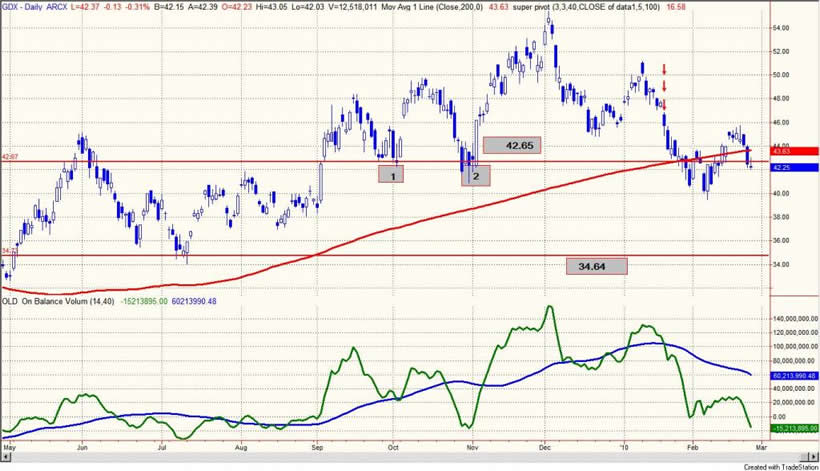
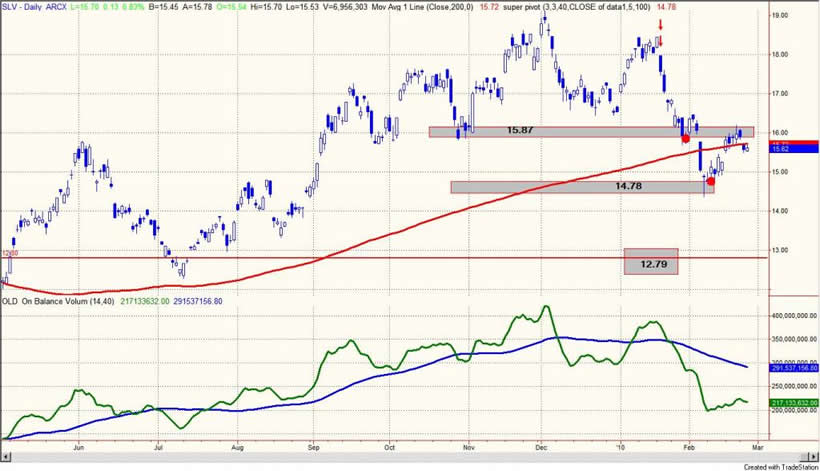
Figure 3 is a daily chart of the i-Shares Silver Trust (symbol: SLV). The red arrows on the chart identify the January 20th price bar. SLV is already below a super pivot having gapped below this level and the 200 day moving average 2 days ago. The next level of support is at 14.78, and I would expect that level to be tested. Below that is 12.79.
Figure 3. SLV/ daily
I know none of this stuff works especially when it doesn't and analysis like this is completely "useless". Yeah, I think I have that quote right!
By Guy Lerner
http://thetechnicaltakedotcom.blogspot.com/
Guy M. Lerner, MD is the founder of ARL Advisers, LLC and managing partner of ARL Investment Partners, L.P. Dr. Lerner utilizes a research driven approach to determine those factors which lead to sustainable moves in the markets. He has developed many proprietary tools and trading models in his quest to outperform. Over the past four years, Lerner has shared his innovative approach with the readers of RealMoney.com and TheStreet.com as a featured columnist. He has been a regular guest on the Money Man Radio Show, DEX-TV, routinely published in the some of the most widely-read financial publications and has been a marquee speaker at financial seminars around the world.
© 2010 Copyright Guy Lerner - All Rights Reserved
Disclaimer: The above is a matter of opinion provided for general information purposes only and is not intended as investment advice. Information and analysis above are derived from sources and utilising methods believed to be reliable, but we cannot accept responsibility for any losses you may incur as a result of this analysis. Individuals should consult with their personal financial advisors.
Guy Lerner Archive |
© 2005-2022 http://www.MarketOracle.co.uk - The Market Oracle is a FREE Daily Financial Markets Analysis & Forecasting online publication.