Leading Economic Indicators Keep Rising, but …
Economics / Economic Recovery Feb 24, 2010 - 08:45 AM GMTBy: Claus_Vogt
 Last Thursday the Conference Board published its Leading Economic Index (LEI) for the U.S. In January this historically-reliable indicator increased 0.3 percent after shooting up 1.2 percent in December and 1.1 percent in November. This was the tenth consecutive rise!
Five of the ten components made positive contributions: The interest rate spread, stock prices, supplier deliveries, factory workweek, and consumer expectations.
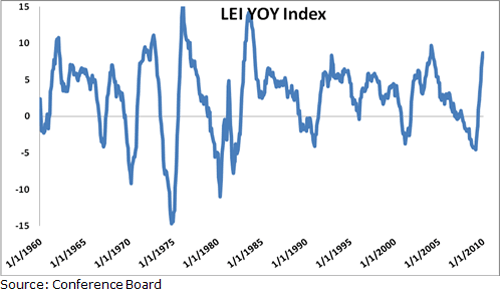
The LEI’s much more important year-over-year percentage change also rose … from 6.7 percent in November, to 8.1 percent in December, to a very healthy 8.7 percent in January. And as you can see on the chart below, it’s approaching a high level by historical standards, too.

So the LEI is probably reaching its zenith in the year-over-year change. I would also note that six-month percentage change weakened from 6.2 percent in December to 4.8 percent in January.
So what does all of this mean?
First, it means that the big economic picture is still looking good. The bounce will probably continue for at least another two quarters, thus supporting a continuation of the medium-term stock market rally.
But thereafter the outlook isn’t so bright …
The Huge Interest Rate Spread Is Important for the LEI
When you look deeper beneath the surface of the LEI, the picture is becoming even more ominous. Especially noteworthy is the contribution of the positive spread between short-term and long-term interest rates. Without it, the LEI would have been down 0.1 percent last month.
You might ask then: What’s wrong with that?
Well, there is nothing wrong with long-term interest rates moving higher than short-term rates. In fact, this is a major tool of monetary policy to subsidize the banks and get bank lending going again. But herein lies the problem …
 |
| Too much easy money can ultimately damage the banking sector. |
In a post-bubble world, monetary policy has much less traction than under normal conditions. If too much debt and too many bad loans are weighing on the banking sector’s balance sheet, monetary policy becomes a rather toothless tiger.
That’s why relying on monetary indicators in forecasting the economy or the stock market becomes dangerous. Moreover, it’s very important to watch the particulars of the LEI.
For instance, the way I use the LEI gave me a bullish signal for the economy after the release of the June 2009 reading in mid-July. And it worked.
However, if the index were to continue to rise while the yield curve (the most heavily weighted component) remained steep and most of the other components began turning down, I would begin to doubt the validity of the LEI’s positive readings.
Remember, Secular Downtrends are Very Volatile
During secular economic downtrends and major crises, volatility increases dramatically — not just in the financial markets, but also in the economy. At least that’s what history tells us.
 |
| The LEI has just flashed a warning sign. |
For example, if you look at the 1930s or the 1970s in the U.S. or the past 20 years in Japan, you can unequivocally see it.
All of these secular economic and stock market downtrends have been severe. Yet all of them have, from time to time, been interrupted by huge jumps in GDP growth — like the 5.7 percent reading for U.S. in the fourth quarter of last year.
I think the weakening in the six-month rate of change of the LEI has to be treated as a first warning sign. A warning sign telling us that the economy is not on a durable growth path. A warning sign, that the second half of this year may become very disappointing.
And with the S&P 500 trading at a 12-month trailing price-earnings ratio of 24.7 and yielding just 2.1 percent, all that’s needed for a major stock market downturn is a slowdown and some disappointment in rather exuberant analysts’ earnings estimates and strategists’ economic outlooks.
Best wishes,
Claus
This investment news is brought to you by Money and Markets. Money and Markets is a free daily investment newsletter from Martin D. Weiss and Weiss Research analysts offering the latest investing news and financial insights for the stock market, including tips and advice on investing in gold, energy and oil. Dr. Weiss is a leader in the fields of investing, interest rates, financial safety and economic forecasting. To view archives or subscribe, visit http://www.moneyandmarkets.com.
© 2005-2022 http://www.MarketOracle.co.uk - The Market Oracle is a FREE Daily Financial Markets Analysis & Forecasting online publication.


