US Super-rich Get Five Times More Income Than in 1995
Politics / Social Issues Feb 23, 2010 - 03:16 AM GMTBy: Global_Research
 Andre Damon writes: The incomes of the very rich in the US grew phenomenally between 1992 and 2007, while their tax rates plummeted, according to recently uncovered IRS statistics.

The figures were published on the IRS web site in December of 2009, but received little notice because they were not announced. The report only became widely known when Tax Analysts, a news outlet for tax information, discovered the document and wrote about it on its web site, tax.com, on Thursday.
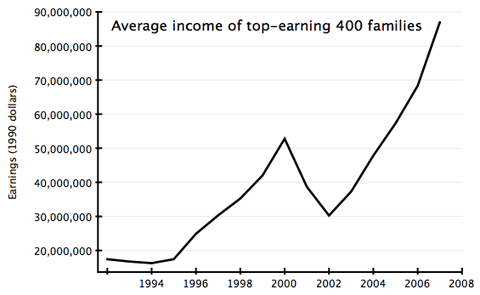
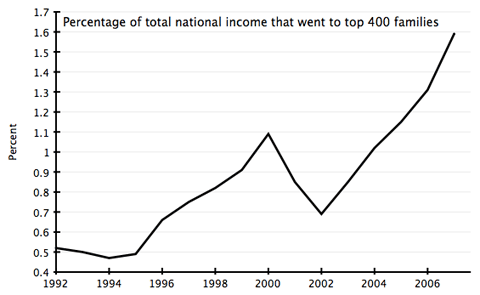
The report shows that the average income for the top-earning 400 families, denominated in 1990 dollars, grew from $17 million to $87 million, representing a five-fold increase in real terms. During this time, the percentage of the total national income that went to the top 400 families tripled, from .52 percent in 1992 to 1.59 in 2007.
The data shows that these families saw their incomes increase by 31 percent between 2006 and 2007 alone, while the average income of each family reached $345 million.
The amount of money earned by the group more than doubled from 2001, when its members earned on average $131.1 million. In 1993, the top 400 tax return filings amounted on average to $46 million. This means that there was an eight-fold nominal increase in the average earnings for this group between 1993 and 2007.
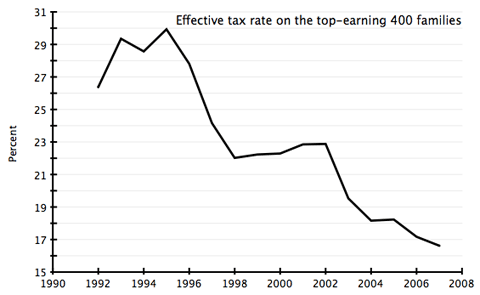
Meanwhile, the effective tax rate on this group—the amount actually paid in taxes—fell to 16.6 percent, the lowest figure on IRS records dating to 1992.

Congressional Democrats have sought to place blame for falling taxes on the wealthy solely on the Bush administration’s tax cuts. But the IRS figures show that the effective tax rate on the top 400 income earners actually fell faster under the last part of the Clinton administration than at any later time.
The effective tax rate hit a high point of nearly 29 percent in 1995. By the end of the Clinton administration, the rate had fallen to 22 percent. The trend continued under Bush, with the effective tax rate falling another 6 percentage points between 2001 and 2007.
The Bush administration lowered the capital gains tax by 5 percentage points, to 15 percent, in 2003. But Bush’s policies were only a continuation of laws passed under the Clinton administration, when the capital gains tax was lowered from 28 percent to 20 percent for the top income brackets.

The top income earners received a total income of $138 billion in 2007. This figure is larger than the yearly output of most of the world’s countries, and is nearly as large as the GDP of Chile. Out of this amount, the group paid only $23 billion in taxes.
If the top 400 earners had been taxed in 2007 at the 1995 rate, they would have paid an additional $18.4 billion in taxes, enough to cover the entire 2010 budget shortfall of the state of California.
About three quarters of income for earners in this tax bracket came from capital gains, which were taxed at 15 percent, as opposed to income, which is taxed at a rate of 35 percent for the top bracket.
The top 400 families actually paid lower taxes compared to other high-income earners. In 2005, the Congressional Budget Office found that the top 1 percent as a whole paid a tax rate of 19.7 percent.
The median 20 percent of income earners paid a tax rate of 12.5 percent, including Social Security payments, which are negligible for the very rich.
The IRS report on the top 400 families was first regularly published by the Clinton administration, but the Bush administration shut down its release, according to the tax.com article by Cay Johnston, a tax law professor at Syracuse University. The Obama administration resumed publication of the figures, with the 2006 figures published about a year ago.
Johnston also noted, “At least three hedge fund managers made $3 billion in 2007.” He added, “Only 33 of the top 400 paid an effective tax rate of 30 percent to 35 percent, which is the maximum federal tax rate.”
The data further substantiates the highly publicized conclusions of economists Thomas Piketty and Emmanuel Saez, who found that two thirds of income increases between 2002 and 2007 went to the wealthiest 1 percent of society and that income for the top 1 percent grew 10 times faster than that of the bottom 90 percent. Piketty and Saez found that the top 1 percent of earners got a higher share of income in 2007 than at any time since 1928.
The latest figures come amid constant calls by the White House and Congress to cut social programs in order to balance the budget. The federal government, we are told, has been bankrupted by the “profligacy” of social programs and the proportion of social resources allocated to the general population.
But the latest figures show that the opposite is true. It is the rich who have bankrupted the state, with the full assistance of the two big-business parties.
Andre Damon is a frequent contributor to Global Research. Global Research Articles by Andre Damon
© Copyright Andre Damon , Global Research, 2010
Disclaimer: The views expressed in this article are the sole responsibility of the author and do not necessarily reflect those of the Centre for Research on Globalization. The contents of this article are of sole responsibility of the author(s). The Centre for Research on Globalization will not be responsible or liable for any inaccurate or incorrect statements contained in this article.
© 2005-2022 http://www.MarketOracle.co.uk - The Market Oracle is a FREE Daily Financial Markets Analysis & Forecasting online publication.


