March is a Good Month for Energy Prices and Stocks
Commodities / Energy Resources Feb 22, 2010 - 10:54 AM GMTBy: Frank_Holmes
 We are entering a time of year that in recent decades has been good for energy prices and energy equities.
Combine that with new estimates that domestic and global energy demand will rise in 2010, and we have the makings of a promising period for investors.
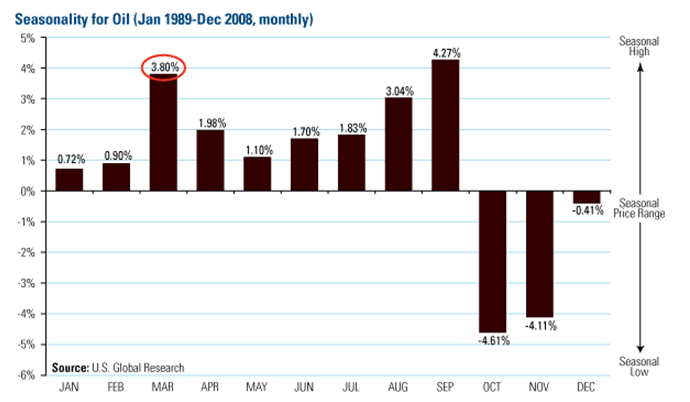
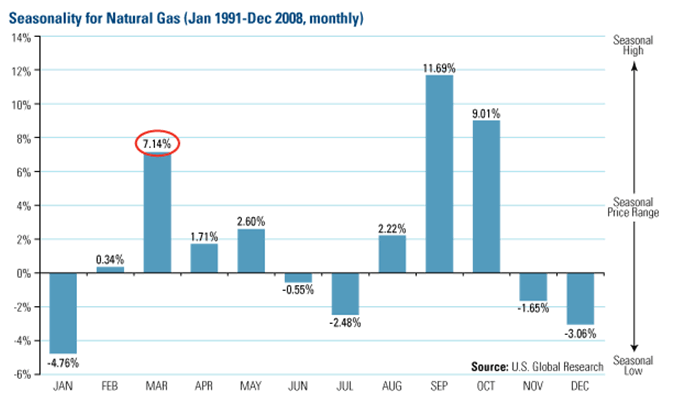
March tends to be one of the best months of the year for both crude oil and natural gas.
As you can see on the charts below, which cover roughly the past 20 years, the price of oil at the end of March is on average nearly 4 percent higher than the closing price in February. For natural gas, the increase is even more eye-catching – gas on average climbs more than 7 percent in March.

The main reason for the oil price rise in March relates to the demand pull created by refiners ramping up in advance of the summer driving season. Crude price increases fall off through the early summer before picking up again in the late summer. From September to October, there is typically a big price drop that continues through year-end.

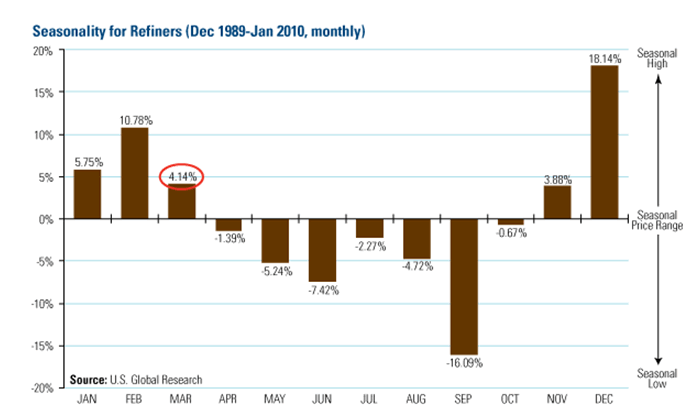
For the refiners, March marks the end of a five-month stretch in which monthly crack spreads (value of refined products minus the price of the crude oil feedstock) tends to increase. If next month follows the pattern, spreads would be 4 percent wider than February. So far in 2010, however, the results have lagged the longer term trend – January saw spreads narrow by about 3.5 percent and for February to date, spreads are up about 2 percent.

For natural gas, which is always extremely volatile, March is a strong month in large part due to late winter snowstorms that move across the country. When you couple that weather variable with the fact that inventory levels for natural gas have usually been drawn down substantially during the winter heating season, the result can be some dramatic spikes for gas.
A cold January lifted spot natural gas prices about 6 percent higher than the December forecast, and in early February gas for April delivery was on average trading 16 percent higher than the same period in 2009.
For energy equities, the typical rally period is February through May. So far, 2010 is not straying too far from that long-term trend: from a peak of 1,122 in early January, the Amex Oil Index (XOI) fell 12 percent by February 9 before heading back up 5 percent over the next six trading sessions.
Of course, seasonality is not a perfect barometer because each year brings its own distinct market conditions. In 2010, the extent of global economic recovery will be a factor, as will economic growth rates in the large emerging nations.
In the U.S., petroleum consumption fell by 820,000 barrels per day (4 percent) last year. Federal officials predict daily oil demand will increase about 1 percent this year, while natural gas demand is expected to increase nearly a half-percent. Gasoline prices may top $3 per gallon this spring, according to the federal outlook.
In its latest monthly report, the International Energy Agency raised its forecast for global oil demand growth to about 1.6 million barrels per day this year, with all of that incremental demand coming from the emerging markets.
China accounts for a quarter of the new global demand for oil. That incremental growth could be revised upward again if it looks like global GDP growth – led by the large emerging economies – will be stronger than the anticipated 4 percent. And if the supply response to additional demand is weak, higher oil prices could result.
Follow U.S. Global Investors on Twitter ;@USFUNDS. Become our fan on Facebook.
By Frank Holmes, CEO , U.S. Global Investors
Frank Holmes is CEO and chief investment officer at U.S. Global Investors , a Texas-based investment adviser that specializes in natural resources, emerging markets and global infrastructure. The company's 13 mutual funds include the Global Resources Fund (PSPFX) , Gold and Precious Metals Fund (USERX) and Global MegaTrends Fund (MEGAX) .
More timely commentary from Frank Holmes is available in his investment blog, “Frank Talk”: www.usfunds.com/franktalk .
Please consider carefully the fund's investment objectives, risks, charges and expenses. For this and other important information, obtain a fund prospectus by visiting www.usfunds.com or by calling 1-800-US-FUNDS (1-800-873-8637). Read it carefully before investing. Distributed by U.S. Global Brokerage, Inc.
All opinions expressed and data provided are subject to change without notice. Some of these opinions may not be appropriate to every investor. Gold funds may be susceptible to adverse economic, political or regulatory developments due to concentrating in a single theme. The price of gold is subject to substantial price fluctuations over short periods of time and may be affected by unpredicted international monetary and political policies. We suggest investing no more than 5% to 10% of your portfolio in gold or gold stocks. The following securities mentioned in the article were held by one or more of U.S. Global Investors family of funds as of 12-31-07 : streetTRACKS Gold Trust.
Frank Holmes Archive |
© 2005-2022 http://www.MarketOracle.co.uk - The Market Oracle is a FREE Daily Financial Markets Analysis & Forecasting online publication.


