Stock Market Chops Shaky Participants into Pieces
Stock-Markets / Stock Index Trading Feb 21, 2010 - 11:23 AM GMTBy: Piazzi
 On Thursday market drifts sideways most of the day. It then finds flashes of bids for a ramp up
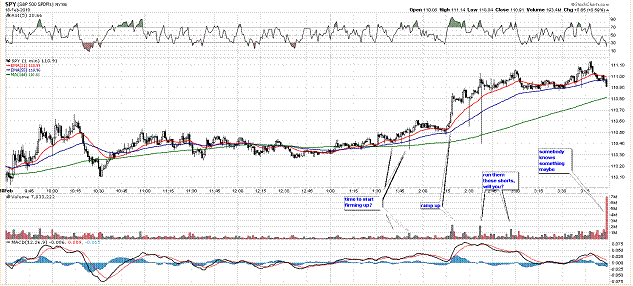
Shorts are whipped all the way into close after 2:00 pm. Then there is some selling into close.
Future markets continue after 4:00. There is some selling after the close
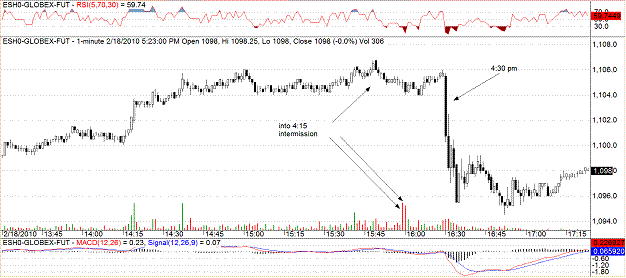
At 4:30 or so the Fed delivers a rate cut news and as that is taking place some people are selling fast and furious while the rest of the world is either oblivious or scratching their head as to what might be happening
Selling continues till well past midnight
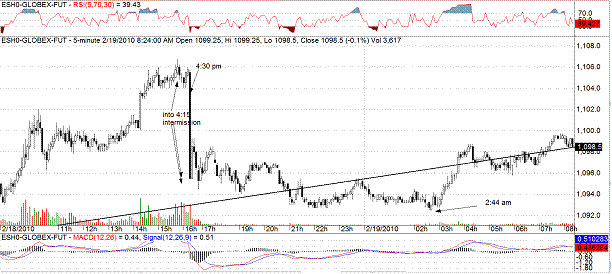
Then some volume (By 2 AM standard) appears and prices start climbing. The climb continues into regular trading hours of Friday, which, by the way, is an option expiration day
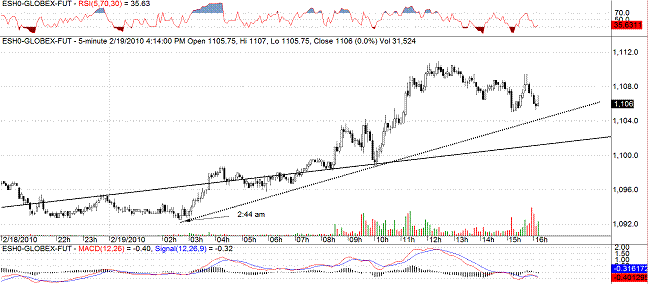
The best course of action, of course, would have been to do nothing as S&P changed only 2 points from Thursday’s close to Friday’s. But, with a well-timed announcement, many and many shorts and longs are forced into action because a lot depends on the closing strike of the OpEx day and many cannot take the chance and have to react fast – their hands are forced, plain and simple.
This is good, fun stuff if you are an observer. It’s a thriller!. For those who are interested in fiction thrillers with a lot of high finance involved and good info to gain, I humbly recommend books of Paul Emil Erdman, look him up, you may enjoy them.
I am sure all sorts of conspiracy theories have emerged and will emerge, but I can see why an announcement like that should come when equity markets are closed. That would give a time window for members of the FED to explain matters if they deem necessary. It also gives players time to examine the situation on their own and in the quietude of closed markets as opposed to the mayhem of a trading day.
As to why the announcement has to be before OpEx day, well, I can see no reason other than being snide, but hey, in matters of money and markets, everybody’s a self-serving player, so, to those who were hurt, grow up and take it!
One thing we should keep in mind is the power bulls have demonstrated since March 2009 in squeezing the shorts into rallies.
And here, again, index rallied to another rally high before settling back into the close.
This is a weekly chart
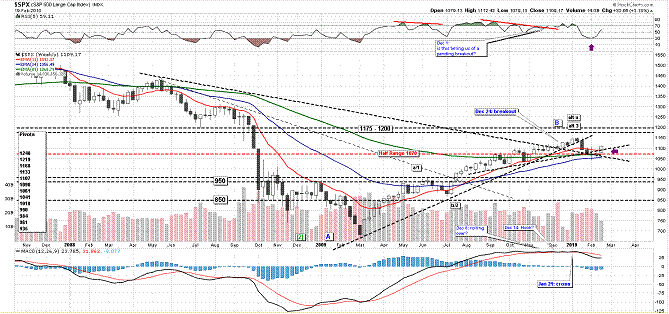
As I have been saying repeatedly, all bears could do with that drop into Feb low was some 10% or so correction, and a test of support. That is, plain and simple, pathetic given all the sky is falling and Greece is burning and China’s bursting hoopla the news has been feeding us. It all may change on Monday, but, seriously, if bears are so cool and mighty how come they can’t break a weekly chart when it is at the point of breaking. They need to do more than just a correction to support. It’s just that simple.
This is a daily chart
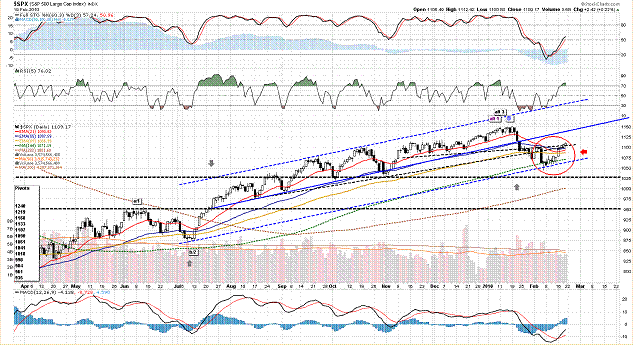
The chart has improved a lot. It so far looks so eerily similar to June-July correction. Look at the shape of the correction. Look at the RSI, and MACD.
I, personally, think that there is another leg down, maybe testing and cutting Feb low, or maybe getting deeper, or whatever, but what I think is of no significance to the market. What market does matters.
With the inability of bears to break the index where and when it mattered, on February 7, the weekend after the low, I said
I think market went into weekend with a state of technical equilibrium, both bulls and bears have to prove themselves in coming days.
Now, I like to know how many pundits, or bloggers or analysts said something like that in such a timely fashion
Am I bragging? Of course, I am :-)
That equilibrium seems to have gone away and index seems, yet again, tilted favorably for the bulls.
There has been a lot of improvement where breadth is concerned. NYSE McClellan Oscillator (MO) has registered a fresh high reading
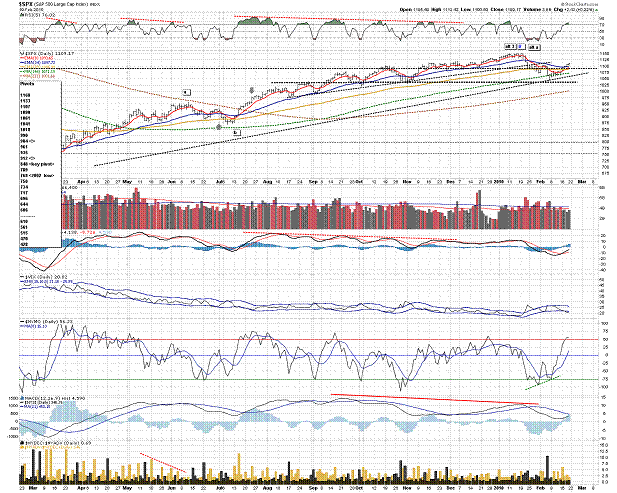
On the way up MO spent no time in neutral territory. It just cut through it.
Net new highs that had dipped below zero has come back strong.
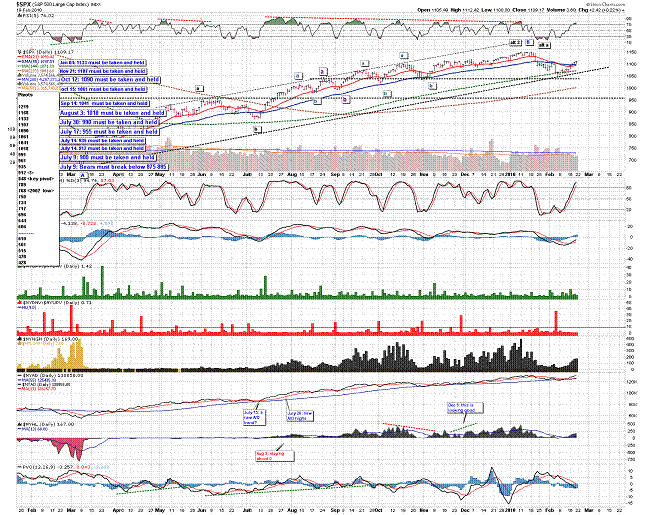
There is lots of improvement on the following
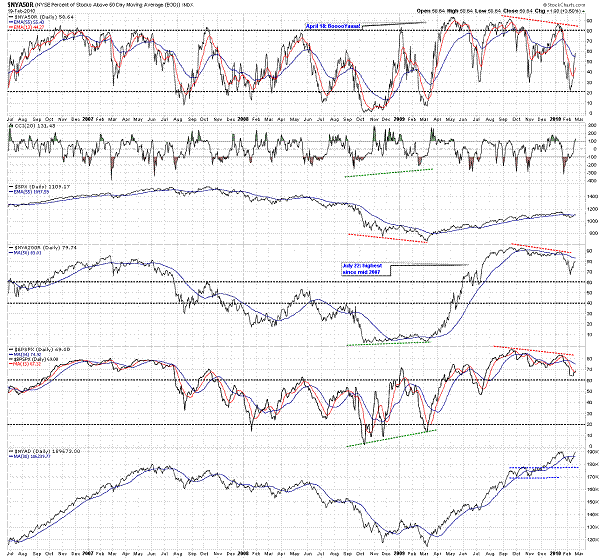
What do bears have to show other than a failed attempt at support?
They tell us that sentiment is bullish.
First, they have been telling us that forever.
Second, what is this sentiment? What was the sample size questioned? How important were those questioned in terms of amount of capital at their disposal? How do we verify the actual market positions of the respondents? Who did the survey? It’s at best he-said-she-said and won’t stand up to the rigors of a market jury, let alone the judge.
Third, even if it is a true survey, and the respondents were 100% truthful with their opinions and positions, sentiment is a lousy indicator when it comes to timing and trade signals. It’s at best a background theme like a curtain to a window. Price can move against published sentiment readings for a long, long time. Stop admiring the curtain! Look through the window! Watch the Price!
One who builds on sentiment alone builds on words, and one who builds on words builds on nothing – Watch the Price!
Bears, also tell us that volume has been lacking from the rally. That is true. But, as I have said before, with an index or a composite, volume may follow price, especially if the move is not believed at first and then starts showing resilience and momentum.
The jury’s still out on that
Since Feb low, bulls have done everything right, they have whipped the bears into rallies, they have mopped up the dips, they have expanded breadth, and they have, according to financial media, shrugged off the rate cut.
But did they really shrug off the rates? Maybe, but so far what we have seen is knee jerk reaction into option expiration with no material effect in terms of point gains. And let us not forget that S&P closed up every day of the last week on below average volume.
With options out of the way, next week should show us the true reaction of the market.
Index has entered overbought areas of the daily frame. It has been over bought on the 60-min chart for a few days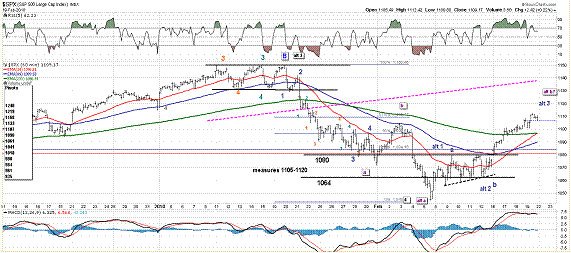
It sure has taken its time being short term overbought as gauged by RSI. My first range target of 1105 was hit with ease. Let’s see if index can hit 1120 or not. I usually don’t risk much on second targets.
I think our mid-term downtrend is not done yet, and expect another leg down. But I am not forever married to that idea. Index will pullback, and that pullback will tell me how right or wrong I am.
That pullback will also tell us what the bears are really made of.
Some are following a super bearish count like this
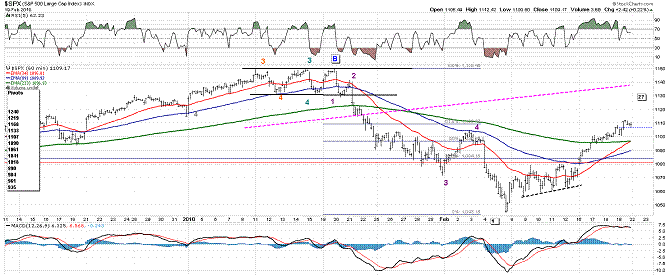
If that is the case, then we should see a wave 3 unfold, and if so, prices should impulse down in a hurry with rapid deterioration in breadth and momentum. Only time will tell, of course, but, based on technical evidence before me, bears have a lot to prove, and they need more than words of mouth and sentiment surveys – they need to sell, break the price, and resist the short squeezes. It’s just that simple!
Let’s Wrap Up:
The state of equilibrium that we correctly identified after the low of Friday, February 5, has shifted into a positive bias towards the bulls.
The move from Feb Lows looks very similar to the one from July lows. While future will tell us how similar they will in fact be. I shall remember that the July move destroyed the bears, and also kept a lot of bulls out waiting for a retest or pullback or whatever.
Bears have failed on many occasions to inflict lasting damage. Feb 5 was another such occasion. If they are serious players, they should at least cause a series of short term lower lows and lower highs.
Bulls need to keep the index above 1061 pivot. For now, as long as 1061 holds, market is either trending up or consolidating.
Support is at 1107 and 1090. Resistance is at 1131 and 1168.
Long term trend is up. Mid-term trend is down. Short term trend is up.
Have a Nice Week!
By Piazzi
http://markettime.blogspot.com/
I am a self taught market participant with more than 12 years of managing my own money. My main approach is to study macro level conditions affecting the markets, and then use technical analysis to either find opportunities or stay out of trouble. Staying out of trouble (a.k.a Loss) is more important to me than making profits. In addition to my self studies of the markets, I have studied Objective Elliott Wave (OEW) under tutorship of Tony Caldaro.
© 2010 Copyright Piazzi - All Rights Reserved Disclaimer: The above is a matter of opinion provided for general information purposes only and is not intended as investment advice. Information and analysis above are derived from sources and utilising methods believed to be reliable, but we cannot accept responsibility for any losses you may incur as a result of this analysis. Individuals should consult with their personal financial advisors.
© 2005-2022 http://www.MarketOracle.co.uk - The Market Oracle is a FREE Daily Financial Markets Analysis & Forecasting online publication.


