Gold, Commodities, Stocks and Financial Markets Mega-analysis
Stock-Markets / Financial Markets 2010 Feb 16, 2010 - 07:17 PM GMT The world’s attention is focused on Greece’s sovereign debt problems – a budget deficit that is 12.7% of gross domestic product. Consequently, Greece needs to sell 53 billion euros of debt this year, the equivalent of about 20% of its gross domestic product.
This has caused the yield on Greek bonds to rise to 7.16%, which in turn lowers bond prices (value). For 2009, Greek bonds had a negative return of 0.76%. The spread between Greek bonds and German bunds is about 300 basis points.
Greece’s bond problems have heightened risk aversion, sparking a sell-off in the euro, and a subsequent flight to safety into the U.S. dollar. Liquidity now trumps all other concerns. Investors are focused on the return of their money, as opposed to the return on their money.
Since the beginning of the year, the euro has declined 5% versus the dollar and almost 8% versus the yen. And Greece is not the only concern on the horizon: Spain, Portugal, Ireland, and other countries have similar debt problems.
As if the above wasn’t enough for the markets to contend with, China decided to raise interest rates on reserve bank deposits, as they did several weeks ago. The People’s Bank of China is trying to reign in loose monetary policies that have caused a crack-up boom and speculative asset bubbles.
Considering all this uncertainty and you can see why investors have become more risk averse. The EU’s announcement to stand behind Greece had a short term calming effect, but the markets want to see something more substantial.
Early next week, the EU ministers are supposed to unveil a financial plan to help Greece. If the market likes what it hears, a relief rally will likely occur. If not, the euro could sell off. All eyes are on Europe.

Stocks
China is supposedly the new global economic leader. Her stock market led the world to new highs when the boom was in full bloom. Now, China has slowed down; and she is raising interest rates.
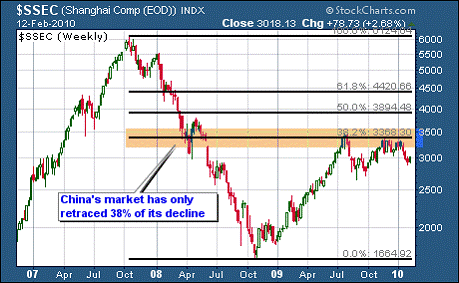
First up is a weekly chart going back three years to 2007, which shows the huge decline the Shanghai Composite took: falling from 6124 to 1664 from high to low.
The chart has a set of Fibonacci sequences overlaid on it that show where important retracement areas reside. Since making its 2007 high, the index put in a low in 2008; and has since rallied back to retrace 38% of the decline, its first Fib level.
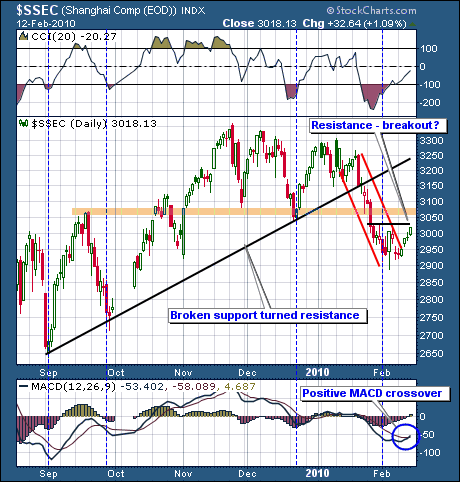
If China is leading the world, its stock market better pick up the pace, because it looks pretty weak on the chart below.
The next chart goes back to Sept. The SSEC index can be seen rising from the bottom left corner of the chart to the upper right corner. This was a bullish signature. However, notice in Dec. how the market started to roll over. It put in a series of lower highs and now it has broken down. The first step to health would be to close above overhead resistance (3025).
MACD has made a positive crossover and the histograms have turned up as well. CCI has moved from heavily oversold (-200) to near zero. If price can break above horizontal resistance a short term rally could develop. Even if a rally occurs, the diagonal trend line represents significant overhead resistance.
The U.S. stock market is being held hostage by the Greek debt problem, waiting to see if a real plan of action is forthcoming. Considering all the bad news thrown at the market lately, it has held up fairly well, gaining about 1%.
The markets look poised and ready for some good news. Several charts have positive set-ups, but follow through confirmation is needed. If stocks move up, I expect gold and commodity stocks will lead.
It all depends on the dollar. If the dollar continues to rally, the other markets will correct; and vice versa.
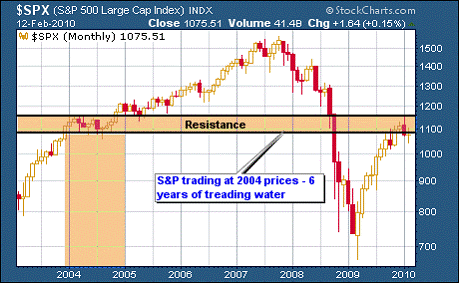
Resistance on the S&P is around 1100. Long term I still believe we are in a bear market counter-trend rally. The chart below shows the S&P at 2004 prices.
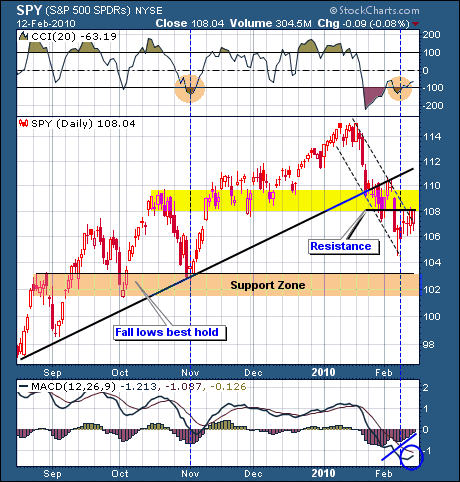
The daily chart shows price bumping into overhead horizontal resistance at 108. The histograms are receding towards zero and MACD looks like it’s getting ready to make a positive crossover. CCI has moved up from oversold. If a rally does occur, the next resistance level is around 111.
Bonds & Rates
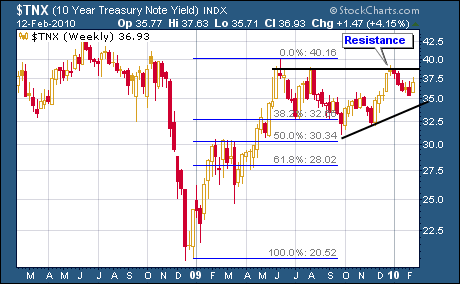
Long term interest rates are rising, suggesting that investors are becoming more risk averse to U.S. Treasury debt, and thus demanding higher yields to make up for the added risk.
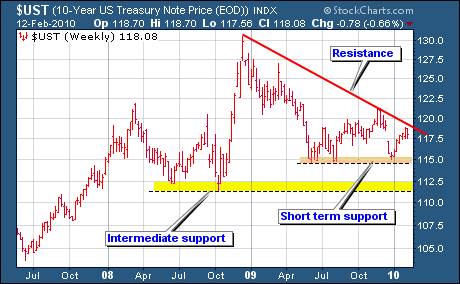
As interest rates rise, bond prices fall, as the chart below shows. Prices are bumping up into overhead resistance and look set to retreat.
Currencies
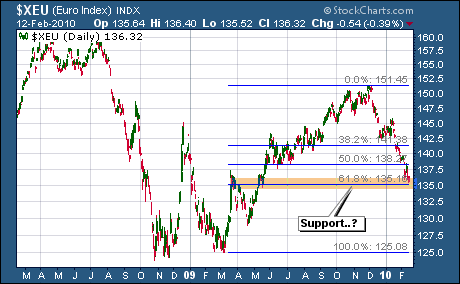
All eyes are on the European Union, waiting to see what concrete plans are offered to help Greece. If the market doesn’t like what it hears, the euro will come under pressure. The chart below shows the euro testing its 62% Fib retracement level.
The next chart shows the relationships between the dollar, gold, and the euro. Gold & the euro tend to move in the opposite direction of the dollar.
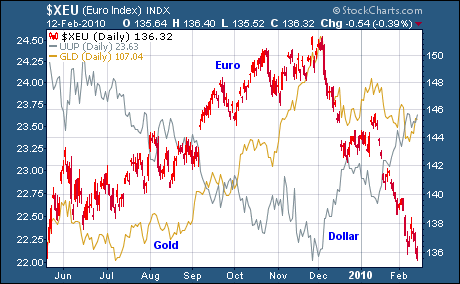
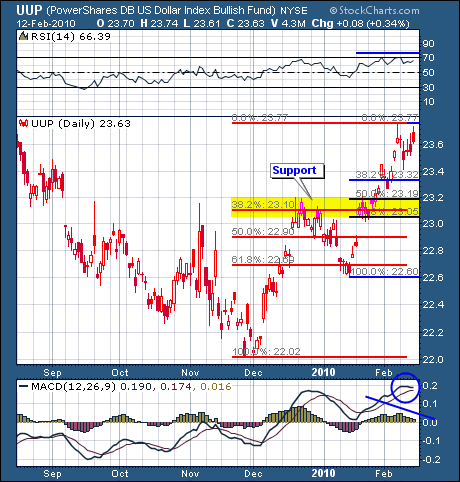
As the euro has been plummeting, the dollar has been rising. Presently, the dollar is overbought and ripe for a correction. This doesn’t mean one will occur. We have seen how assets can stay overbought or oversold for longer periods than seem reasonable. That is what markets do: whatever they want, when they want, how they want.
There are two sets of Fibonacci retracement numbers on the chart below. The first is from the Dec. low up to the Feb. high. The second set is from the Jan. reaction low to the Feb. high. The yellow horizontal band marks overlapping Fib levels from both sets. Such intersecting levels can represent significant support and resistance levels.
Commodities
With the recent rally in the dollar, commodities have been correcting. As with the other markets, the fate of commodities rests with the dollar. There is no denying that all goods are priced in dollars. Consequently, when the dollar falls in value, prices of stuff goes up. When the dollar rises, the prices of goods fall.
The chart below shows the inverse relation of the dollar to commodities. From March to November commodities rose, while the dollar continued to tumble. Since Dec. the dollar has rallied, and starting in January commodities have fallen.
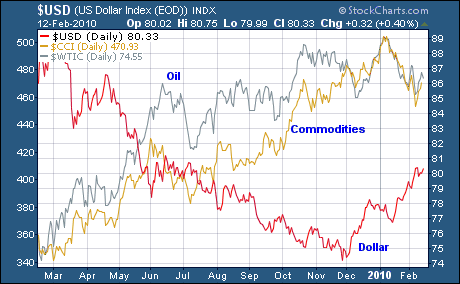
The above chart suggests that if the dollar corrects, commodities will likely move up, especially the precious metals. If the European Union does not come up with a viable plan to help Greece, the dollar will continue to stay overbought, as the safe haven play for liquidity continues.
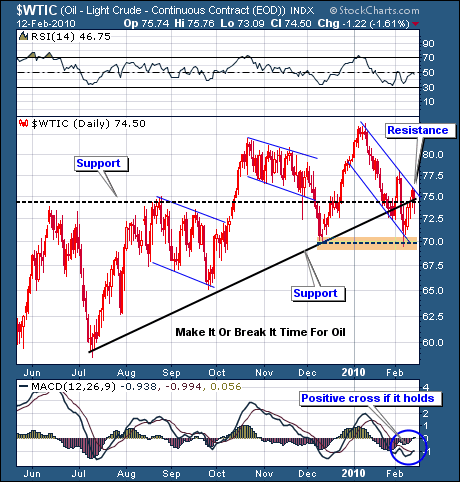
It is make it or break it time for oil. Price broke below its diagonal trend line in Feb. and tested horizontal support going back to the Dec. low, which held.
Price then rallied back above its diagonal trend line and above horizontal support going back to June. It is presently testing resistance (75) as indicated on the chart.
A breakout would open the door for a run at the Jan. high, while a breakdown would be bearish, especially if horizontal support at 70 is taken out. MACD has made a slight positive crossover, which hints that a rally may be forthcoming. Once again, the direction of the dollar looms large.
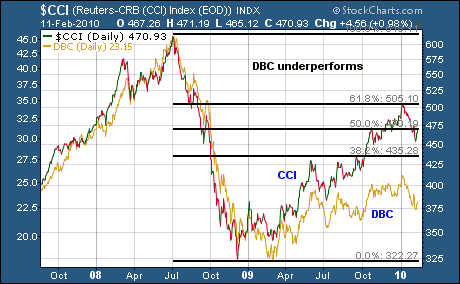
Up next is the daily chart of the CCI index with overlays of DBC and the Fib retracement levels from the 2008 low. Notice how DBC has underperformed the CCI index. DBC like UNG and other funds that are supposed to track the underlying asset(s) do not seem to do the job they are supposed to.

Gold
Gold was up $27.10 to close at $1099.30 for a weekly gain of 2.54%. This was a good performance considering that the dollar was up for the week as well. It seems that gold is sensing or expecting the dollar to correct.
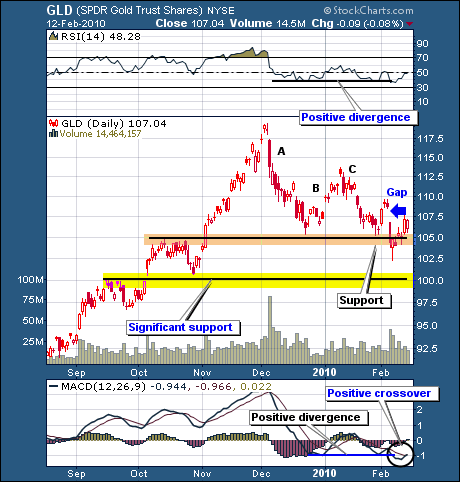
In last week’s report I stated that: Downside momentum is waning and RSI and the histograms are showing slight positive divergences. Friday’s candlestick was a hammer, which suggests that downside momentum is turning and that a short term reversal may be at hand. The open gap above looks inviting.
While gold did rally up $27 the gap has yet to be filled. There are positive divergences in both RSI & MACD, and MACD has made a positive crossover. The histograms have turned positive as well.
The weight of the evidence points to higher prices, but the dollar and Greece’s debt problems will play heavily into the mix.
Also, even if a rally occurs, it may not be anything more than a short term affair. There may yet be another downside move that tests the $1000 breakout area. I have discussed this for weeks and it still remains a viable scenario.
If a short term rally unfolds, it should be taken one day at a time. Constant reassessments of the landscape will be needed and adjustments made accordingly.
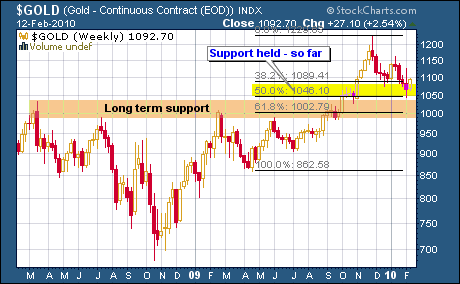
The second chart below (weekly) shows that the 50% Fib retracement level has held as support thus far.
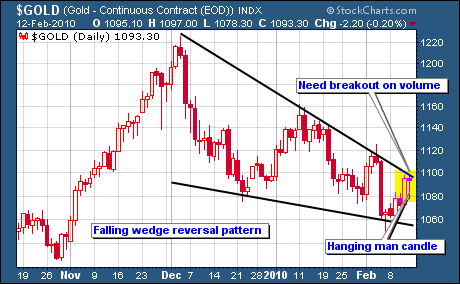
Next up is the daily gold chart, which shows a falling wedge pattern that is usually indicative of a reversal, but not always. A breakout above the upper trend line is needed on expanding volume.
Of some concern is Friday’s hanging man candle that often times means that upside momentum is waning; however, it needs to be confirmed. We will know soon enough.
Silver
Silver added 0.35 cents, closing the week out at $15.52, for a +2.27% gain.
From last week’s report I wrote:
Notice the huge spike in volume on Friday. Friday’s candlestick (hammer) suggests that downside momentum may be waning. Prices fell considerably farther down during the day, but by the close they regained most of the lost ground. CCI must advance up through – 100 for any bounce to hold.
So, we got a bounce, but it has yet to be determined if it has legs. As with gold’s advance, it will depend on what the dollar does, and that will depend on what the EU does about Greece (in the short term).
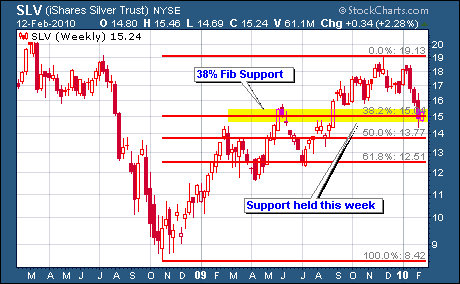
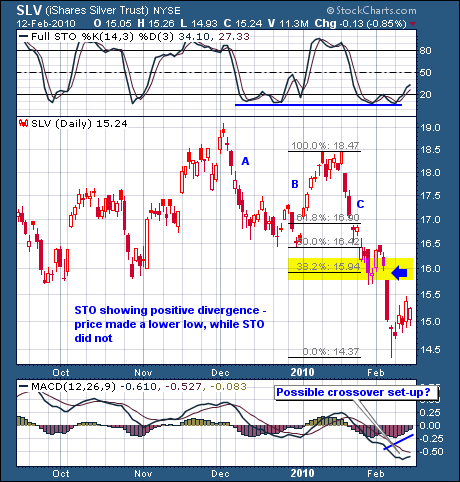
Up next is the daily chart of SLV. An A-B-C correction can be seen on the chart. The question is whether the correction is over or not. Notice that in late Jan. there was a similar quick rally that gave way, leaving an open gap behind.
The histograms are receding back towards zero and MACD appears to be setting up for a positive crossover. STO at the top of the chart is showing a positive divergence: price made a lower low, while STO did not.
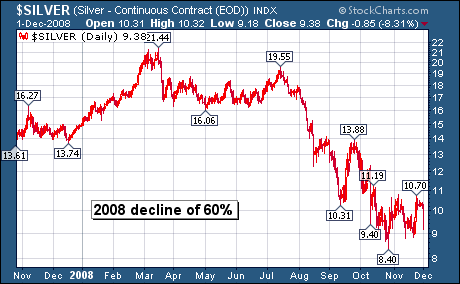
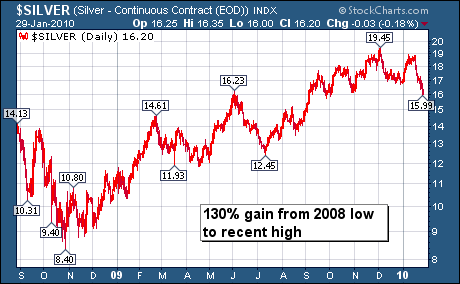
The above chart shows the huge drop silver had from its 2008 highs (21.44) down to its 2008 lows (8.40) – a decline of 60%. The chart below shows the subsequent rise from the 2008 low to the recent Dec. high (19.45) – a 130% advance.
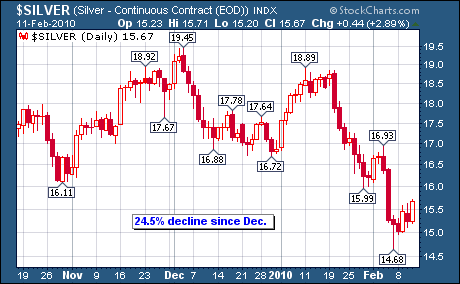
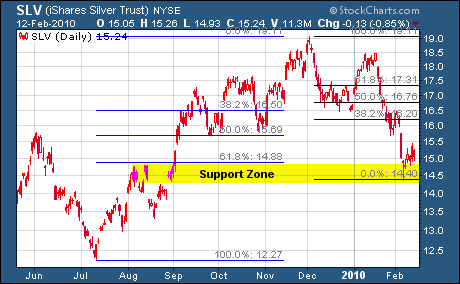
Above: the 24% decline from the Dec. high (19.45) to the recent low (14.68). Below: two sets of Fib retracements: the blue is from the July low to the Dec. high; and the red set is from the Dec. high to the recent low.
Gold Stocks
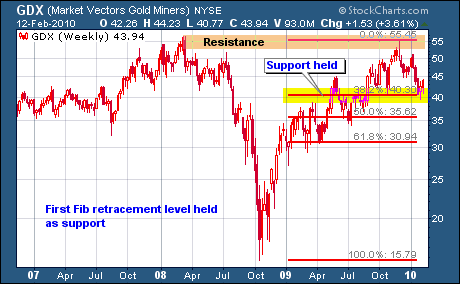
The gold stocks had a good week, gaining +3.61%. As with the other markets, the pm stocks are basically on hold waiting for word from the EU on Greece and the dollar’s subsequent reaction thereto.
On Friday the gold stocks were hit pretty hard in the morning, but they came back to recoup most of their losses. Some actually closed up on the day. Considering the amount of bad news, I thought the action was encouraging, hinting at a short term rally.
In last week’s report I stated:
After all the dust settled, the gold stocks, as represented by the GDX index, gained 4% for the week, with their big +5% reversal day on Friday. Last week’s report stated that we were closer to the end then the beginning of the correction; however, this does not mean that the exact end is definitively here. Friday’s huge candlestick suggests a reversal, which now must be confirmed by follow through action.
Even if a snap back rally unfolds, it is still possible for the GDX to correct further down and make new lows, so we must be patient and take one step at a time. Let’s see if we get a snap back rally; and if we do, reassess the new landscape that comes with it. Then we go from there.
We’ve gotten a bit of a rally, but the burden of proof is on this week’s reaction to whatever news come out of the EU. If the market likes what it hears, the dollar should correct, and gold will advance – if.
Last week’s action was promising, but it still needs follow-through confirmation.
The daily chart shows support at 40 holding, with resistance above around 45-46. MACD has made a positive crossover, and the histograms have turned positive as well. CCI has moved from oversold to positive territory, suggesting further upside is likely.
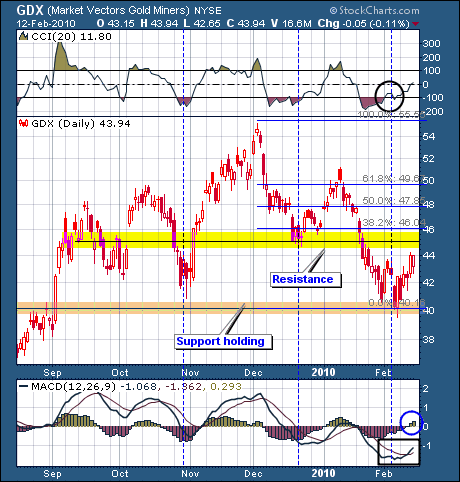
The weekly chart shows that support marked by the 38% Fib level has held so far. Overhead resistance is indicated.
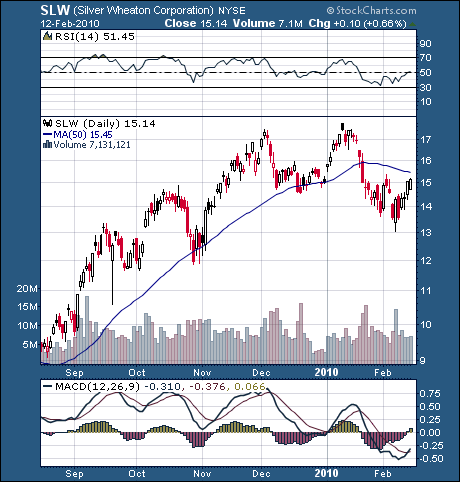
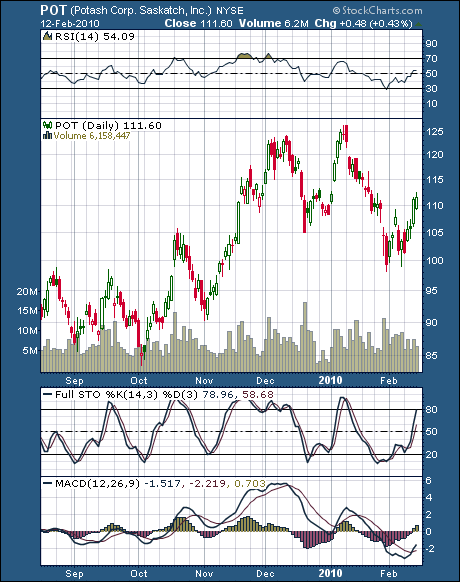
Stock Watch List
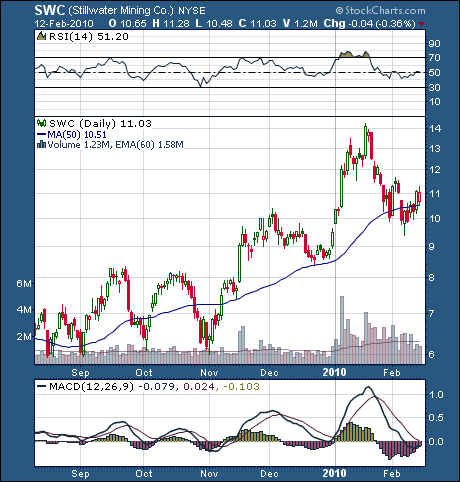
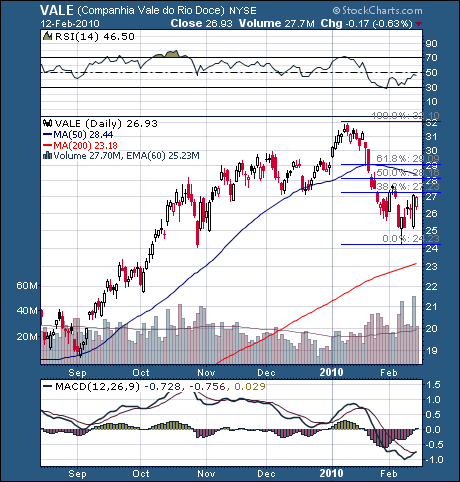
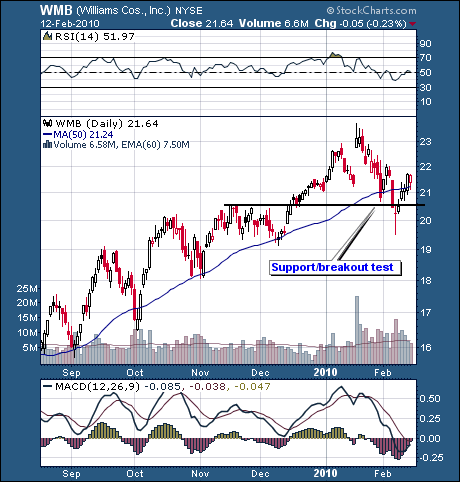
MODEL PORTFOLIO
- Physical gold – 20%
- Physical silver – 20%
- Precious Metal Stocks – 15%
- Other Commodities (oil, agriculture/food, natural gas, industrial metals) – 4%
- Treasury Bills – 31%
- Other (special situations: takeovers, short funds, currency funds, emerging markets) – 10%
Physical holdings for gold & silver are now listed at 20% per. Several weeks ago they were raised from 15% to 15-20%, leaving it up to the individual when to increase holdings during the recent correction. There is still a good chance that prices go lower (test 1000) before the next big advance begins.
So, one could still be waiting to cost average in. It is up to individual preference, both as to the exact timing and the allocation between gold & silver. The above are simply rough guidelines.
Precious metal stocks have been increased from 10% to 15%. Once again, this is up to individual preference, as this may end up being just a trading opportunity at best; and not an intermediate term swing low for investing purposes. Each must decide for themselves.
Good luck. Good trading. Good health, and that’s a wrap.

Come visit our website: Honest Money Gold & Silver Report
New Audio-Book Now Available - Honest Money
Douglas V. Gnazzo
Honest Money Gold & Silver Report
About the author: Douglas V. Gnazzo writes for numerous websites and his work appears both here and abroad. Mr. Gnazzo is a listed scholar for the Foundation for the Advancement of Monetary Education (FAME).
Disclaimer: The contents of this article represent the opinions of Douglas V. Gnazzo. Nothing contained herein is intended as investment advice or recommendations for specific investment decisions, and you should not rely on it as such. Douglas V. Gnazzo is not a registered investment advisor. Information and analysis above are derived from sources and using methods believed to be reliable, but Douglas. V. Gnazzo cannot accept responsibility for any trading losses you may incur as a result of your reliance on this analysis and will not be held liable for the consequence of reliance upon any opinion or statement contained herein or any omission. Individuals should consult with their broker and personal financial advisors before engaging in any trading activities. Do your own due diligence regarding personal investment decisions. This article may contain information that is confidential and/or protected by law. The purpose of this article is intended to be used as an educational discussion of the issues involved. Douglas V. Gnazzo is not a lawyer or a legal scholar. Information and analysis derived from the quoted sources are believed to be reliable and are offered in good faith. Only a highly trained and certified and registered legal professional should be regarded as an authority on the issues involved; and all those seeking such an authoritative opinion should do their own due diligence and seek out the advice of a legal professional. Lastly Douglas V. Gnazzo believes that The United States of America is the greatest country on Earth, but that it can yet become greater. This article is written to help facilitate that greater becoming. God Bless America.
Douglas V. Gnazzo © 2009 All Rights Reserved
© 2005-2022 http://www.MarketOracle.co.uk - The Market Oracle is a FREE Daily Financial Markets Analysis & Forecasting online publication.


