Germany (EWG), Spain (EWP), Japan (EWJ), China (XFI), and Russia (RSX) and then the dollar (UUP) and gold (GLD) ETF Charts of the Week
Companies / Exchange Traded Funds Feb 15, 2010 - 02:23 AM GMTBy: Mike_Paulenoff
 In our Charts of the Week this week, we look at S&P 500 (SPY) in comparison to international indexes for Germany (EWG), Spain (EWP), Japan (EWJ), China (XFI), and Russia (RSX) and then the dollar (UUP) and gold (GLD).
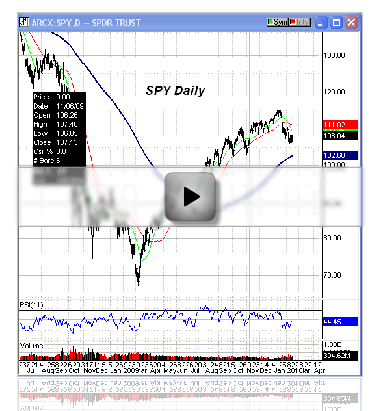
The S&P 500 Depository Receipts (SPY) closed at 108.04 Friday, and a lot of people think it will go back up to the 109 area. The SPY has resistance at the 20-day moving average at 109.35. However, my cycle work shows that the price ought to begin weakening in preparation for the next cycle low in the 20-22 cycle, due at the end of February. In addition, downside can be expected to gain momentum in sympathy with the 18-20 week cycle, which hits its cycle low at the end of March.
The iShares MSCI Germany Index (EWG), by comparison, doesn't look anything like its U.S. index counterpart. It has a big top that started back in Aug/Sept and broke down at the end of January. So, when the S&P 500 was peaking at the end of January, Germany was already accelerating to the downside, possibly in anticipation of the Greece problem.
When comparing the EWG to the SPY, you'll see that the juxtaposition of the 200-day moving average is totally different. While the SPY is well above its 200-day moving average at 102.60, the EWG is still below its 200-day (20.74), closing Friday at 19.77. Any rally will have to first have to get over the 200-day in the German ETF.
Even weaker than Germany is the Spain index, where the iShares MSCI Spain (EWP) is currently 13% below its 200-day moving average.
By contrast, Japan is acting much better than the European indices and is second strongest only to the U.S. The iShares MSCI Japan Index (EWJ) has been consolidating in the last week or so right above the 200-day average at 9.71, and the price structure in the 200-day is rising.
While Japan is still in a deflationary recessionary environment, the highest ETF PowerRating country fund is the widely-traded EWP. That’s not to say that everyone should go out and buy Japan stocks based on this chart. However, if you had allocated money, you would probably want to allocate more in the S&P 500 and EWJ and would probably be exiting or have less allocation in Europe.
Surprisingly, the chart on China is weaker than that of its Japan neighbor, with the iShares China Index (FXI) showing a pretty nasty little top. The top started to develop last August, and broke down in January along with all the other indices. Even though the 200-day is rising, the 20-day is leaning right against Friday’s close and is sharply declining at 39.26 (the FXI closed at 38.91).
It will be interesting to watch the FXI over the next couple days to see if it can claw its way back to the 200-day. If it can't, it will mostly likely roll over and head toward 35 in what will be the continuation of a very bearish phase for China.
Moving over to Russia, we see that the Market Vectors Russia ETF (RSX) is well above its 200-day moving average and although it has come down since mid-Jan like the other indexes, it looks more like the S&P 500 than any of the other indexes.
The RSX is another place where I would consider allocating funds. It even looks healthier than Japan, so in the order of allocation I would put the S&P 500 first, Russia second, then Japan, and then China and Europe.
The RSX, while it looks like it could be forming a top, is a lot less mature and a lot healthier from a moving average standpoint than most of the other indices with the exception of the S&P 500.
That’s not to say this is the end of a correction for equities, but only to say who are the strongest players in a rough neighborhood for equities.
Outside equities, there is strength in the SPDR Gold Shares (GLD), which had a very interesting week last week. It bottomed February 5 and rallied from 1.02 up to 1.07 or 5%, above it 200 DMA, which was a very impressive performance.
The PowerShares DB US Dollar Index Bullish (UUP) also held up extremely well last week, down a half percent -- in what is a very bullish pattern above its 200-day.
So you have the dollar and gold acting similarly. Is it possible that gold could be making significant low and inverting in its relationship with the dollar? Perhaps.
The dollar, like the S&P 500, is the best of its kind in a bad neighborhood (currencies) and is attracting funds, while gold is benefiting from people’s fear.
Sign up for a free 15-day trial to Mike's ETF & Stock Trading Diary today.
By Mike Paulenoff
Mike Paulenoff is author of MPTrader.com (www.mptrader.com), a real-time diary of his technical analysis and trading alerts on ETFs covering metals, energy, equity indices, currencies, Treasuries, and specific industries and international regions.
© 2002-2010 MPTrader.com, an AdviceTrade publication. All rights reserved. Any publication, distribution, retransmission or reproduction of information or data contained on this Web site without written consent from MPTrader is prohibited. See our disclaimer.
Mike Paulenoff Archive |
© 2005-2022 http://www.MarketOracle.co.uk - The Market Oracle is a FREE Daily Financial Markets Analysis & Forecasting online publication.


