


Commodity Pendulum Swings and U.S. Treasury Long-Bond Futures Inaccurate Chart Trend
Stock-Markets / Financial Markets 2010 Feb 15, 2010 - 01:49 AM GMTBy: Howard_Katz

 Below is a chart of the 30 year Treasury bond (future) as it is reported on all charting web sites. The chart does not seem to have a discernible pattern but rather to be what the random walk theorists believe – a meaningless collection of zigs and zags with no predictive power.
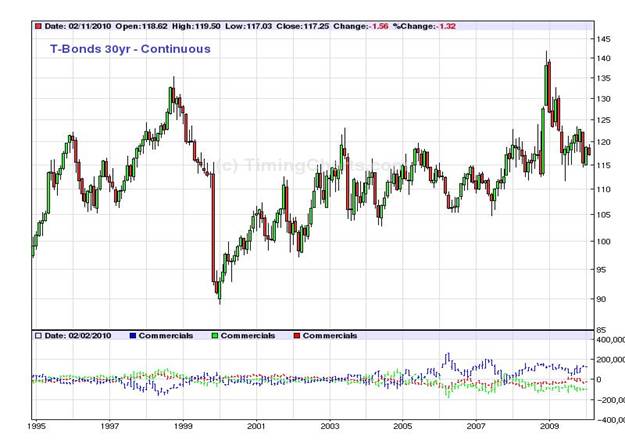
But hey, what is that giant decline at the end of 1999. It seems that T-bonds dropped from 113 to 93 in just one month. Boy, that must have been one nasty news item. Perhaps the Fed announced a major tightening. Perhaps the European Central Bank made some unpleasant statements about the value of the dollar. Perhaps a socialist was elected President of the United states.
No, none of these things happened. What happened was as follows. What is called the 30 year bond is represented on the futures market by a collection of 20+ year bonds which are averaged to get the price we see reported. In December 1999, the mix of 20+ year bonds was changed, and the result was a stated price which differed by 20 points from the previous price. The long bond itself did not change. And bond yields did not change. In reality, it was a non-event.
One would expect that the charting sites would make the simple mathematical adjustment so that data prior to 1999 could be interpreted in a consistent manner with data after this date. But I have not found any web site which made this simple adjustment. For your eyes, I have constructed the correct chart below.
30 YEAR T-BOND, 1981-2009
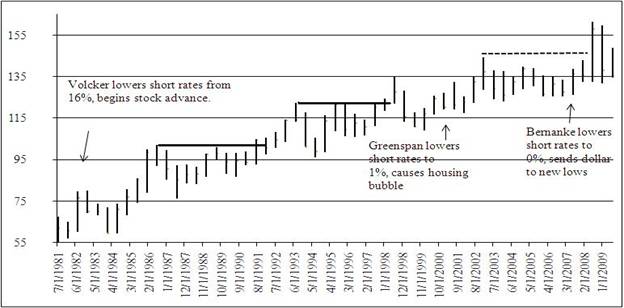
The above chart (the real one) makes much more sense to the chartist. Notice the steady, stair-step up trend in bonds (as one Fed chair after the other kept lowering rates).
This chart contains a lot more information. Notice that, as short rates have dropped to virtually 0, long rates have remained steady at about 4½%. Notice also that bonds have been unable to advance for the past 5 years except for a brief panic in the autumn of 2008, and this advance was rapidly given back. What could be the reason for this? Bernanke has been easing to beat the band, but it is very hard for him to get long rates to follow short rates.
A simple reason would be that the real rate at which prices are advancing here in the U.S. is 4½% and therefore that long rates are now 0. Short rates are completely determined by the Fed. But long rates, while influenced by the Fed, are also influenced by the general credit market, and for rates to go below 0 (real) requires enormous forces. In other words, Bernanke, in practical terms, cannot ease any more. And this strongly suggests that the next important move in rates will be up and in bond prices will be down.
But my point here is not to discuss theory. We have discussed theory many times in the past, and I have pointed out the absurd theoretical errors made by most of the people who try to dignify themselves with the name economist. But the above error is not an error of theory. Anybody with half a brain can look at the first chart and see that something has to be wrong. Markets don’t just lose 18% of their value in one fell swoop and for no reason. If I had a web site and something like that showed up on it, I would darned sure want to know why.
This is the problem with our age. So much data is being shoveled out at us that the human mind cannot comprehend it. The human mind is overwhelmed. Back in the days before the computer the need for understanding the data was much greater than the need for more data. Then the computer hit us with x raised to the google power more data, and no one understands what they are doing any longer.
Sad, dear gold bug, sad. You were born in an evil age. Teachers in our colleges teach lies. Marriage counslors are mostly all divorced. Reggie Lewis’ “dream team” cardiologist died from the same disease he was treating Reggie for. We lost the war on cancer (but most of the people in our society keep donating their money to the losers, and cancer keeps winning). This is the first generation in American history (since 1623) to see a decline in its real wages. 59% of our Senators favor socialized medicine on the grounds that it has been a disaster in every country in which it has been tried.
And all around the country there are financial talk shows telling you that their goal is to help you plan for retirement. Most of these shows will advise you to “buy and hold good, sound stocks for the long pull.” The stock market, they will tell you, always goes up. “It always has.”
Is this true? Does the stock market always go up? You might think that a person who confidently makes such an assertion has checked it out. But if we decide to check this out, we get a surprise. The father of all stock market statisticians is Charles Dow, who invented the Dow Jones Industrials in 1896. However, it is little known that Dow was experimenting with stock averages as far back as 1885. If we take those early stock averages and map them on to the Dow Jones Industrials, then we find that in that age stocks moved sideways. Indeed, from the first index in 1885 up to 1932, stocks, as measured by Charles Dow, did not advance..
There is a simple reason for this. Stocks compete with one another. There is a normal return on capital, whether it is interest on a savings account or a bond or yield on a stock. These yields compete with each other. In the late 19th and early 20th centuries, it was normal to have a 5% yield on bonds and an 8% yield on stocks. The extra 3% for stocks was considered fair compensation for the extra risk. If stock yields, for example, had dropped from 8% to 6%, then investors would have sold stocks and shifted their capital into bonds (for the simple reason that the greater safety was worth a lot more to most people than the 1% difference).
Stocks do go up in our post 1933 society for the reason that the Federal Reserve lowers interest rates below their free market level This pulls stock yields down as well, and that puts stock prices up. For example, the newly created Fed of 1914 lowered interest rates from 6% to 3%. This caused stock yields to fall in half and stock prices to double. (The lower interest rates also cause a rise in corporate profits, which adds to the effect.) The increase in stock prices since 1932 is due primarily to these two effects.
]
The idea of people retiring by taking speculative profits out of the stock market is absurd. There is no wealth created when stocks go up. Wealth consists of good and services. Imagine that your neighborhood gang gets together for a Saturday night poker game. Can you plan to retire on your winnings? No, your winnings are someone else’s losses, and the evening’s events do not include the creation of wealth. (There is an exception here for the speculator who is smarter than the other speculators, but we will discuss that below.)
Real American retirement was based on the system invented by Noah Webster (the publisher of the first American dictionary and the father of America’s copyright laws). Webster traveled through the 13 new states in 1785-86 and convinced legislators (in the North) to abolish the laws prohibiting the payment of interest.
Now that interest was legal, people started to save. They put their savings into banks or bought corporate bonds. This money was then lent to businessmen, who used it to buy the best machines. These new machines vastly increased the production of wealth. The businessmen then used their higher profits to lower prices for the consumer, raise wages and pay interest to the savers.
This regular interest (of about 5%) at the time when the currency was stable in value was an enormous benefit to the average person. If you save your money at 5% interest over a working lifetime of 49 years, your net savings will multiply by 4¼ times, and it is this fact which enabled Americans from 1800-1933 to retire.
But no more. Since 1933, the U.S. currency has depreciated just as rapidly as interest has accumulated. In real terms, you are getting 0 interest. But if the real rate of interest is 0, then you can not retire. And all these people trying to take each other’s money in the stock market are fools because, when the stock market rises, no new wealth is being created. (Stocks go up when the central bank eases. This is an anti-free market activity. It both destroys wealth and also shuffles it around from one group to another. This is no way to stimulate an economy.)
There is one exception to this, and it is based on my principle of the commodity pendulum. When the commodity pendulum is on the up side, you put your money into commodies (principally gold). When the pendulum is on the down side, you put your money into stocks. Unfortunately, the last time the commodity pendulum was on the up side, the establishment insisted on staying in stocks all the way down. Finally they turned bearish on stocks in 1982 – exactly at the borrom (in real terms) of the stock market. So far in the second swing of the commodity pendulum they are making the exact same mistake.
So it is possible to retire today by folloiwng the principle of Yogi Bear who, as you remember, was “smarter than the other bears.” So although it is sad to live in a period of general public irrationality, it gives you the chance to win by beating all those irrational people. I publish a fortnightly letter called the One-handed Economist ($300/yr.) which shows you how to take advantage of the commodity pendulum by putting your money into gold (and related goods) and thus be smarter than the other speculators. There is a $5 cash discount. So you may send a check for $295 to: The One-handed Economist, 614 Nashua St. #122, Milford, N.H. 03055. Or you may visit my web site, www.thegoldspeculator.com, and use the Paypal buttom.
Thank you for your interest.
© 2010 Copyright Howard S. Katz - All Rights Reserved Disclaimer: The above is a matter of opinion provided for general information purposes only and is not intended as investment advice. Information and analysis above are derived from sources and utilising methods believed to be reliable, but we cannot accept responsibility for any losses you may incur as a result of this analysis. Individuals should consult with their personal financial advisors.
© 2005-2022 http://www.MarketOracle.co.uk - The Market Oracle is a FREE Daily Financial Markets Analysis & Forecasting online publication.