


Stock Market To Go Lower Before Going Higher
Stock-Markets / Stock Markets 2010 Feb 12, 2010 - 12:24 PM GMTBy: Guy_Lerner

 In the short term, the equity markets are just holding on. Risk trade on. Risk trade off. One day up and one day down. I have identified one reason to be long and in the markets (i.e., Rydex market timers turning bearish), but I have been very clear that this Rydex "strategy" is a very short term play. Remember, in this strategy, winning trades only last on average 6 trading days.
Contrary to the shorter term outlook, I have been a bit more insistent on this idea that the next real buying opportunity for the intermediate term trader will be when the "dumb money" turns bearish. This would be a bullish signal. As I have stated in my weekly sentiment articles, the best way for the "dumb money" to turn bearish is to have lower prices.
But what is the basis for that claim? Can't the markets go higher -much higher- without sentiment turning really bearish? They can as anything is possible, but that usually or historically isn't how it works. More likely, this cyclical bull market within a secular bear, will sell off. Support levels will be breached and the weak hands will move to the side lines. The markets will reverse back above those old and broken support levels leaving the weak hands to pay up and chase price thus propelling the markets higher.
Let me give you an example graphically. Look at figure 1, a weekly chart of the S&P Depository Receipts (symbol: SPY). This shows a snap shot of the 2003 to 2007 bull market. The black dots on the chart are pivot low points or some folks may identify these as swing points. You will also note buy and sell signals on the chart.
Figure 1. SPY/ 2003-2007/ weekly
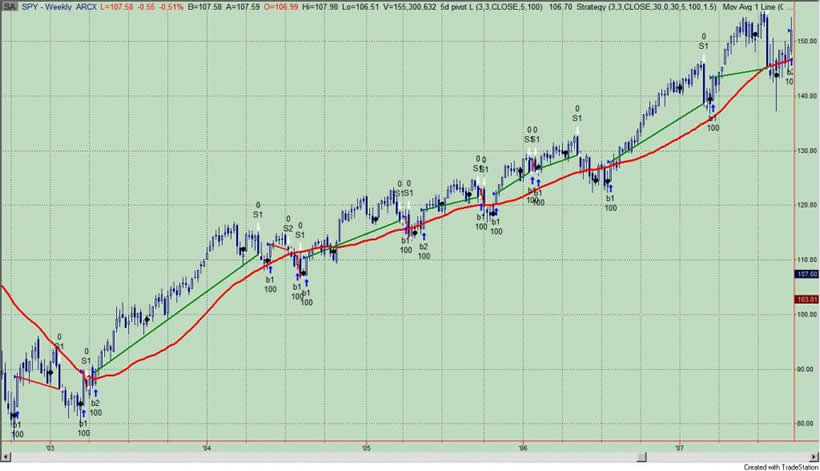
So what have I done? I basically developed a strategy to buy the SPY if the prior weekly close was below either of the two previous pivot low points and if the current weekly close was now above those pivot points. In other words and in my world, the pivot low points are areas of support and resistance, so what I have tried to replicate is this notion of bull markets shaking out the weak hands (i.e., break below the pivot low point or support) and then reversing higher with a close back above this pivot point.
Got it? And on first glance that is exactly what we see from the 2003 to 2007 bull market. You get a down move, a shakeout or close below a pivot, and a move higher or close above a pivot. The pivot low points are only acting as signposts of areas of buying and selling. There is nothing really special about these pivots.
I am not trying to develop a strategy here, but I am trying to show you how prices behave or move in a bull market. But this strategy would be a good place to start. Why? Since 1994, this strategy, as outlined, would beat buy and hold S&P500 by 50%; however, draw downs would only be reduced by 20% or so. This strategy would beat a simple moving average strategy such as buying and selling above and below the 40 week moving average respectively by about 50% with a 50% reduction in the draw down. As stated, this is a good place to start.
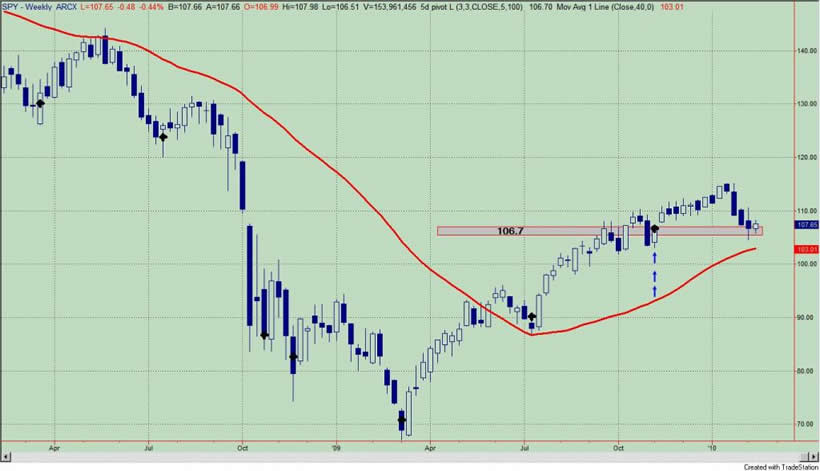
Ok, so what does this have to do with the current market? Now let's look at a current weekly chart of the SPY. See figure 2 with our pivot low points. The most recent pivot low point is at 106.70. Last Friday, the SPY closed at 106.66. Sitting at support? Yes and good enough for government work, but prices did close below the pivot point. This week it is likely that the SPY will end the week above 106.70. Of course, this would trigger a buy signal from our strategy suggesting that it is time for the cyclical bull market to resume. (As a side note, for those who doubt the relevance of 106.70 on the SPY, just look at where the buying was today.)
Figure 2. SPY/ weekly
But here is the problem. When going back over the strategy and looking at where the best buying points were, it is clear that investor sentiment, as measured by the "Dumb Money" indicator, had to turn bearish first. In other words, if prices closed below a pivot low point and investor sentiment did not turn bearish, then the resulting up move back through the pivot was likely to lead to a false signal. It was just noise.
So if we add a filter or requirement that investor sentiment must turn bearish (bull signal), we can actually eliminate the number of losing trades with this strategy from 19 to 11; we can increase profits by about 10% and more importantly, we decrease draw down by a very substantial 50% over the original strategy. Furthermore, by spending less time in the market and being selective, we have improved the efficiency in which we make money. That is always a good thing.
So let's summarize. There is nothing magical about my pivot points. A close below and a close above a pivot low point is "typical" price behavior in a bull market. It is likely that the SPY will close above a pivot low point this week and one would interpret this as a bullish signal. I believe that it is a false signal. A better signal would be in the context of extreme bearish sentiment amongst investors. This is why I think we need to go lower before going higher. Lower prices will lead to a more lasting rally.
By Guy Lerner
http://thetechnicaltakedotcom.blogspot.com/
Guy M. Lerner, MD is the founder of ARL Advisers, LLC and managing partner of ARL Investment Partners, L.P. Dr. Lerner utilizes a research driven approach to determine those factors which lead to sustainable moves in the markets. He has developed many proprietary tools and trading models in his quest to outperform. Over the past four years, Lerner has shared his innovative approach with the readers of RealMoney.com and TheStreet.com as a featured columnist. He has been a regular guest on the Money Man Radio Show, DEX-TV, routinely published in the some of the most widely-read financial publications and has been a marquee speaker at financial seminars around the world.
© 2010 Copyright Guy Lerner - All Rights Reserved
Disclaimer: The above is a matter of opinion provided for general information purposes only and is not intended as investment advice. Information and analysis above are derived from sources and utilising methods believed to be reliable, but we cannot accept responsibility for any losses you may incur as a result of this analysis. Individuals should consult with their personal financial advisors.
Guy Lerner Archive |
© 2005-2022 http://www.MarketOracle.co.uk - The Market Oracle is a FREE Daily Financial Markets Analysis & Forecasting online publication.