Global Business Cycle Bottoms But Economic Recovery Remains Mixed
Economics / Economic Recovery Feb 12, 2010 - 03:10 AM GMTBy: Donald_W_Dony
 Global data continues to reinforce the idea that the world business cycle has bottomed and that growth is starting to advance. Economic numbers stress that after six quarters of steady contraction, a floor appears to have formed in mid-2009. Most global economies have felt expansion for the last six months. But this increase is not well divided. Domestic developed nations have emerged from the depths at a considerably slower pace than many Asian nations. The USA has been dwarfed by the new Asian economies of China and India. This trend, going into 2010 and 2011, will likely reshape the trading patterns of the world from west to east.

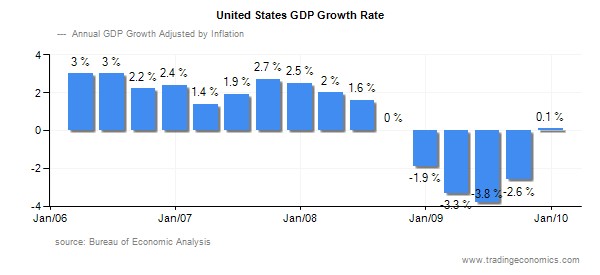
The United States (Chart 1) still remains the largest economy in the world and represents about 23% of the total. Expansion of its gross domestic product (GDP) was at a mire 0.10% during the last quarter. This meager results, however, did pull the economy into the plus numbers for the first time in over a year. With inflation adjusted to 2.6%, the likelihood of growth above 1.0% in Q1 seems promising. Unemployment numbers appear to have peaked. The slow and bumpy road to recovery is beginning.

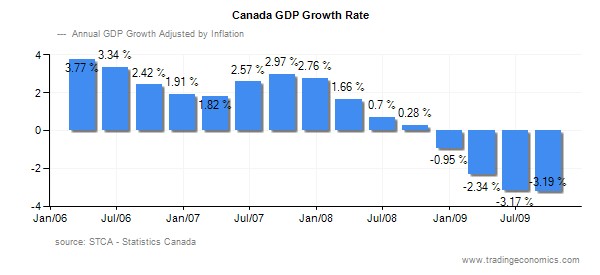
A similar picture is unfolding for America's principal trading partner. After seven quarters of contraction, Canada's economic bottomed with the rest of the world in mid-2009 (Chart 2). Now with two quarters of steady growth under its belt (4th GDP numbers show 1.2%), current data points to a continued recovery in 2010. Canada represents just 2.26% of the world's economy.
In the other block of developed nations (Eurozone), the economic data persistently displays weakness. Though the bottom in GDP contraction developed in mid-2009, the road upward has been extremely painful and slow. 3rd and 4th quarter numbers are still in the red (-4.0% and -3.1%) and debt concerns with many members weighs heavily and remains disruptive to future growth.

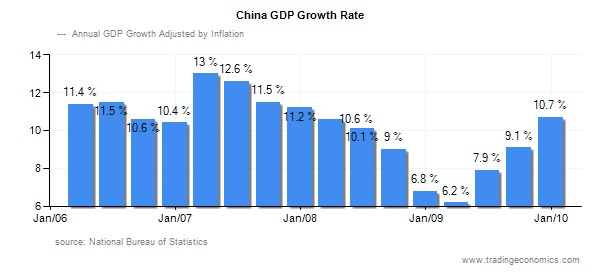
In contrast to the often sluggish return to positive expansion for development nations, Asian economies are setting the bar very high. China's economy (now number two ahead of Japan) suffered eight quarters of contraction (Chart 3) but bottomed ahead of the global average and has printed three quarters of robust growth. GDP numbers show a return to double-digits. First quarter estimates are equally as high.

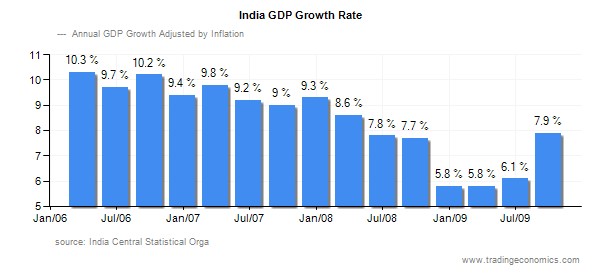
As the world's biggest democracy, India's progressive growth has been equally impressive with China. After only four quarters of financial slowdown, this economy has rebounded sharply (Chart 4). Expansion for the third quarter was 7.9% and 5.7% for the fourth. The outlook for the rest of 2010 seems equally strong and bright. The average posted growth rate since 1997 for India has been an impressive 7%, well above the world norm.
Bottom line: Latest data continues to support the picture of a world economy that has reached a floor and starting to expand. Renewed growth appears to be established with most economies now displaying positive numbers. Domestic and developed nations, which once ruled the domain of growth have sifted into second place behind the higher GDP nations of China and India. These patterns do not short-term. They can be expected to persist into this new business cycle.
Investment approach: Strong top performing economies normally have the best performing stock indexes. The once dominant S&P 500 has remained in a bear market for the past decade. GDP growth for the USA has been pinned under 3% whereas emerging nations have doubled or tripled those numbers. Investors can capture the expected growth of Asian stock markets through exchange traded funds. Suggested ETFs in CDN are Claymore's BRIC (CBQ), iShares China Index Fund-XCH, iShares S&P India Index Fund-XID. In US$, FTSE China-FXI and iPath India-INP are noteworthy.
More research can be found in the February newsletter. Go to www.technicalspeculator.com and click on member login for the full report.
Your comments are always welcomed.
By Donald W. Dony, FCSI, MFTA
www.technicalspeculator.com
COPYRIGHT © 2010 Donald W. Dony
Donald W. Dony, FCSI, MFTA has been in the investment profession for over 20 years, first as a stock broker in the mid 1980's and then as the principal of D. W. Dony and Associates Inc., a financial consulting firm to present. He is the editor and publisher of the Technical Speculator, a monthly international investment newsletter, which specializes in major world equity markets, currencies, bonds and interest rates as well as the precious metals markets.
Donald is also an instructor for the Canadian Securities Institute (CSI). He is often called upon to design technical analysis training programs and to provide teaching to industry professionals on technical analysis at many of Canada's leading brokerage firms. He is a respected specialist in the area of intermarket and cycle analysis and a frequent speaker at investment conferences.
Mr. Dony is a member of the Canadian Society of Technical Analysts (CSTA) and the International Federation of Technical Analysts (IFTA).
Donald W. Dony Archive |
© 2005-2022 http://www.MarketOracle.co.uk - The Market Oracle is a FREE Daily Financial Markets Analysis & Forecasting online publication.


