Silver Elliott Wave Analysis and Forecast Update
Commodities / Gold and Silver 2010 Feb 11, 2010 - 03:22 PM GMTBy: Alistair_Gilbert
 This a brief follow up to my Report of 13th January advising a SELL of Silver at $18.52. Silver has since been sold down to $14.62 in Wave 3 of 1 of C of Major Wave 2.
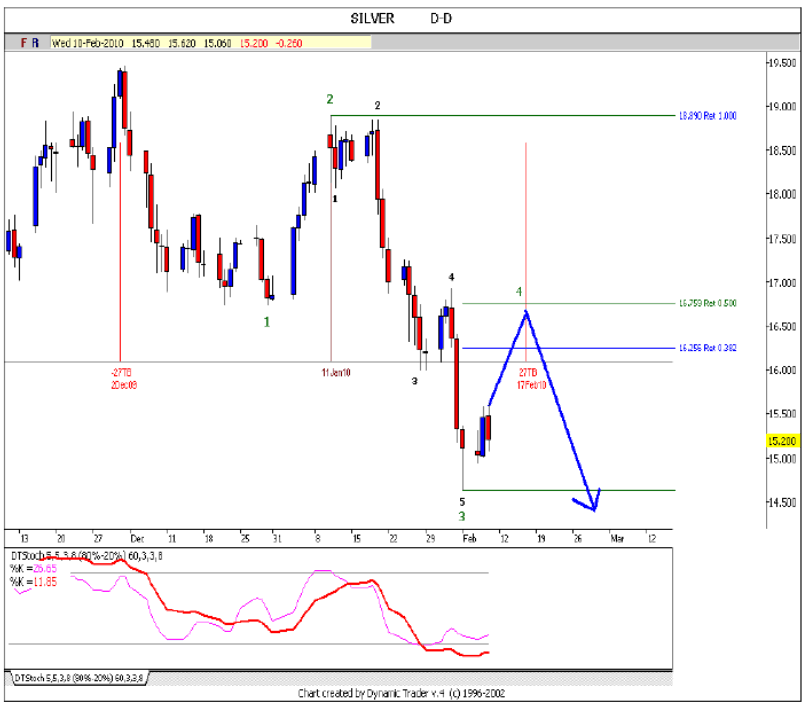
In Wave 4 of 1 we can expect to see typically a retracement of Wave 3 of between 38.2% to 50%. This would give us a target of $16.25 for the 38.2% and $16.75 for a 50% retracement. Obviously the wave 4 retracement can halt anywhere between those two targets and given the pressure to the downside in wave 5 may even fall a bit short.
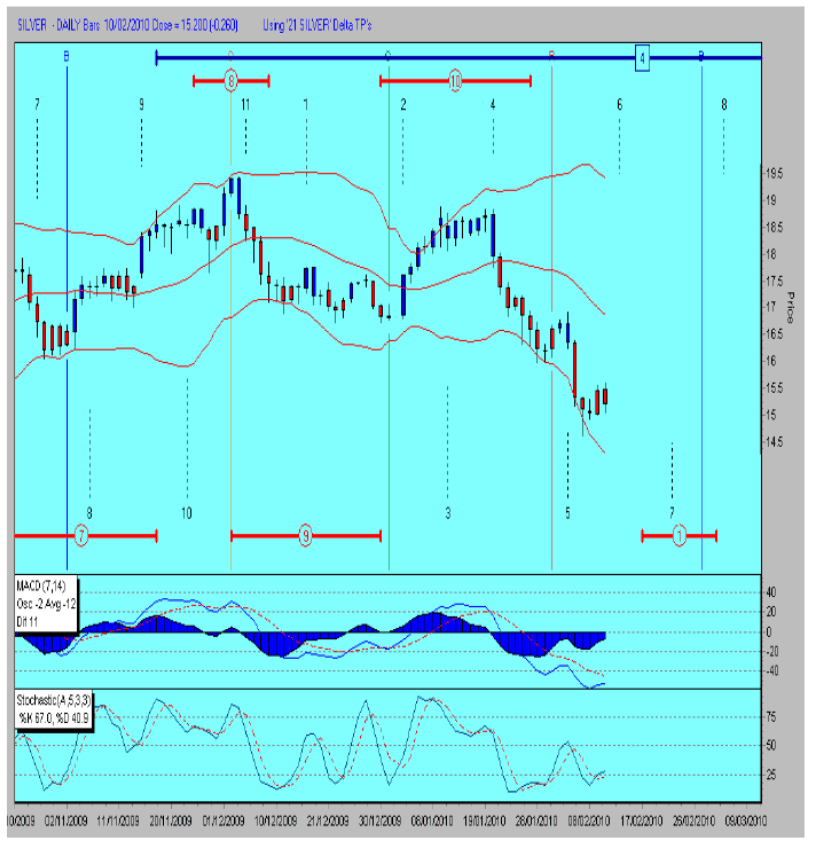
First let us look at the DELTA Daily chart. First thing to notice is that ITD 5 arrived two days late. This helps me as DELTA is looking for a high tomorrow in Silver and I am looking for 16th/17th February which is also two days late. After that we should be heading down in a 5th wave to ITD 7 due 23rd February, which should bring in MTD 1 low.
Note on this chart how we have positive divergence on the MACD Histogram as we have a higher low despite a lower low in PRICE.
The 5 period Stochastic is showing similar positive divergence.

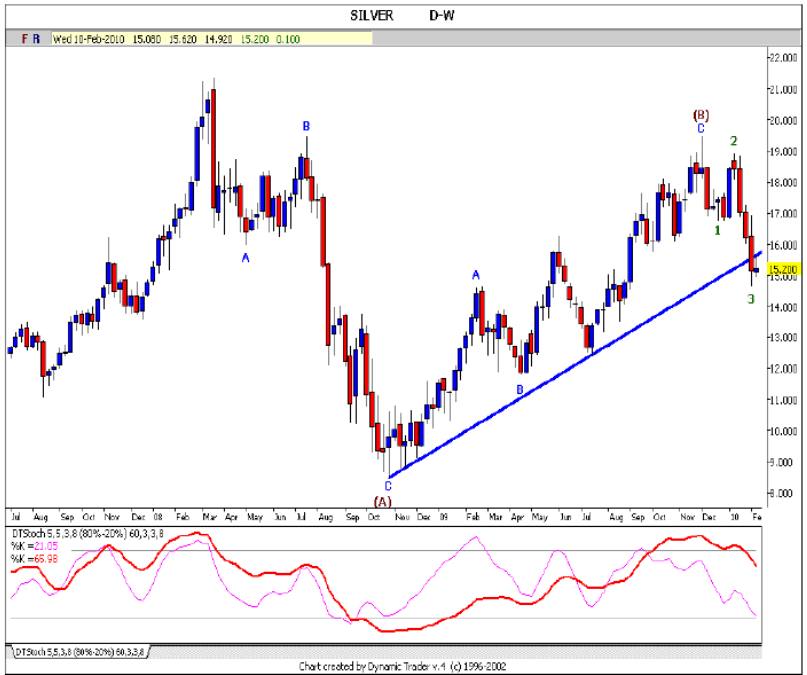
Moving on to the big picture, my weekly DT chart shows how Major Wave 1 topped in March 2008 and we moved down for an “A” wave into October 2008 and up for a “B” wave into December 2009. We are now heading down in the “C” wave which should last until January 2011, and this would complete Major Wave 2. The 3 waves of (C) illustrated are 3 of 1 of (C).

I have put two Stochastics on here as the 60 period clearly illustrates where tops should be and that we have a long way to go down. The 5 period shows that we are approaching the oversold area in a few weeks which confirms my count.
Moving on to my Daily DT chart, you can see my wave count and also how my 27 Traded Day cycle points to 17th February for the top of wave 4. My shorter term wave count for traders showing the internals of Wave 4 of C of 4 is posted on the Bulletin Board.

By Alistair Gilbert
ALISTAIR GILBERT has worked in the markets for over 30 years. He has worked as an institutional research analyst for a firm of stockbrokers where he got his grounding as a technical analyst. He has also worked as branch manager of a firm of stockbrokers managing private client portfolios and as a fund manager for a leading merchant bank. Alistair was also Managing Director of a Swiss Fund Management group with over $1 billion under management and developed the business extensively in the Middle East.
Alistair has now returned to his native England where he now specialises in TIME and PRICE analysis utilising Elliott Wave, DELTA and a range of technical indicators. I can be contacted via alistair@alistairgilbert.com
Copyright 2010 Alistair Gilbert
Disclaimer: The ideas expressed in this Report are the thoughts of Alistair Gilbert and represent part of the intricate process that he goes through before arriving at a trading decision and as such are like a trading diary. Alistair Gilbert is not an authorised investment adviser and as such none of his statements should be construed as investment advice. The value of investments can go up as well as down and trading is very high risk. Readers are advised to consult with their own investment advisers who may be better qualified to offer a trading strategy based on your own individual circumstances.
Alistair Gilbert Archive |
© 2005-2022 http://www.MarketOracle.co.uk - The Market Oracle is a FREE Daily Financial Markets Analysis & Forecasting online publication.


