Stock & Commodity Markets Warning, January Barometer Points to Bear Markets
Stock-Markets / Stocks Bear Market Feb 04, 2010 - 01:05 PM GMTBy: Gary_Dorsch
 Beware! It was a cold January on Wall Street. The S&P-500 Index lost 3.7% of its value in January, the biggest monthly setback in a year’s time, succumbing to heavy selling, especially after US President Barack Obama and his economic adviser Paul Volcker, shocked the markets, by calling for stricter limits on the “proprietary trading,” activities of Wall Street’s titans, - aiming to rein-in their ability to buy and sell commodities, derivatives, and equities for their own accounts.
The fear of Washington re-imposing the 1930’s-era Glass-Steagall laws, requiring the separation of commercial and investment banking, rattled the stock market bulls, and extended the S&P-500’s slide to a 6.7% retreat from its most recent high of 1150, set on January 19th. It’s a worrisome sign for traders who see the first month of the year as a trendsetter for the next 11-months that follow. According to the so-called January Barometer, - as January goes, so goes the year.
Since 1950, there were only six-times when January got it wrong in a big way, giving it an accuracy rate of 90-percent. However, in 2009, the January Barometer went terribly awry, and its reputation was badly tarnished. Although the S&P-500 suffered an -8.5% loss in January 2009, portending another year of negative returns, quite the opposite occurred. The S&P-500 index finished the year with a 23.5% gain, following a spectacular 65% rebound from its bear market bottom.
 The Nasdaq ended up 44%, and the Shanghai Composite Index rallied 80% for the year. The Euro- Stoxx 600 Index gained 28%, its biggest annual increase in a decade. Dollar inflows to Brazil totaled $28.7-billion in 2009, lifting the ballistic Brazilian Bovespa stock index up 81%, and the Brazilian real up 33% against the dollar. The CRB commodities index climbed about 24% last year, sealed its biggest annual gain since the 1973 oil crisis.
Unprecedented intervention by the Group-of-20 central banks and governments, including $13-trillion in bank guarantees, monetization of government debt, bailouts, and the alteration of FASB #157 in the United States, was deployed in a coordinated strategy, in order to overturn the bearish tide, and putting a big monkey wrench in the January barometer. A nine-month rally was underpinned by expectations that a global economic recovery, would spur capital spending for technology, and increase demand for energy, metals and other natural resources.
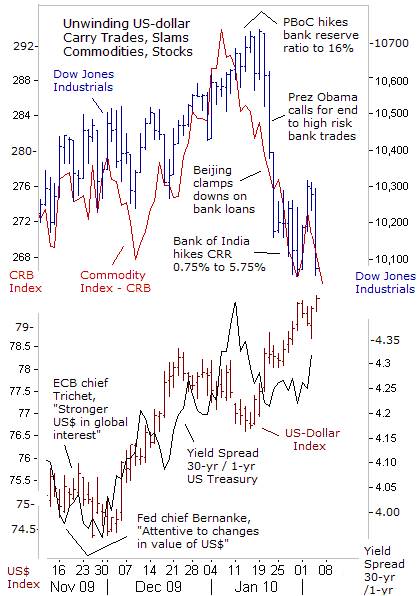
However, January 2010 got off to a rocky start, with commodity and stock markets tumbling worldwide, on signals that the politicians pulling the strings in the world’s two fastest growing economies - China and India, have given instructions to start withdrawing large dosages of monetary stimulus. News that Beijing is clamping down very hard on bank lending, and draining yuan through “Quantitative Tightening,” has sent shock waves from Asia, to London, to Wall Street, and Brazil, and convinced many speculators to dump over-extended long positions in key commodities, such as copper, crude oil, rubber, platinum, and soybeans.
The Reuters-Jefferies CRB Index, a basket of 19-exchange traded commodities, suffered a loss of 6% in January, led by the copper market - rudely interrupted with a sharp 9% decline, and crude oil fell 8%, all tracking losses on the Shanghai stock market, which surrendered 8.8% of its value. On Feb 1st, Fan Gang, a top advisor to the People’s Bank of China’s (PBoC) monetary policy committee, said Beijing must address the problems caused by excessive liquidity, and that inflation and asset bubbles are the biggest worries for the Chinese central bank.
 Selling pressure in commodities in January was extenuated by a stronger US-dollar - which knocked its top rival, the Euro, below $1.400 for the first time in more than six-months. Big speculators began to unwind the massive US-dollar carry trade that was utilized for risky bets in global stock markets. In a virtuous cycle, a stronger US-dollar makes commodities more costly for users of other monies, and helps to contain inflation. Ironically, it wasn’t the Federal Reserve that ignited the unwinding of US-dollar carry trades, but rather the central banks of China and India.
Chinese and Indian policymakers became alarmed by the sharp rebound in industrial commodities, particularly crude oil, which must be imported in large quantities, in order to fuel their manufacturing based economies. Higher food and energy costs feed heavily into the consumer price indexes of the emerging Asian giants, and adjustments of interest rates and other monetary tools are often utilized by their central banks to contain inflationary pressures.
Global demand for crude oil has been buoyed by a powerful rebound in global factory activity, led by the United States, where the ISM factory index rose to a reding of 58.4 in January from 54.9 in December, it’s highest level in six-years. India’s Purchasing Managers’ Index (PMI) rose to 57.7 in January, consistent with double-digit increases in industrial production. Overall, the global manufacturing PMI rose to 56.1 in January, up from 54.6 in December, which combines data from the United States, Japan, Germany, France, Britain, China, and Russia.
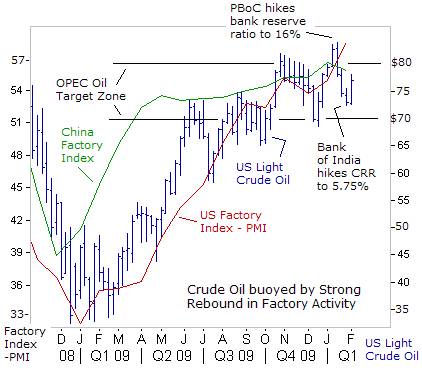
Over the past four-months, US light crude oil has mostly confined within OPEC’s target zone of $70-to-$80 /barrel. “We are satisfied with the market situation of $80 /barrel, said Libya’s oil chief Shokri Ghanem on Jan 13th. “I don’t think an action will be taken to increase production, unless the price reaches $100,” he said. However, once crude oil prices surged above the upper limit of OPEC’s targeted range, Beijing acted to snuff-out the crude oil rally as it approached $84 /barrel.
 On Jan 12th, the PBoC shocked the global markets, with its first meaningful move to tighten liquidity in eighteen months. Armed with knowledge that China’s economy was growing at a 10.7% annualized rate in the fourth quarter and with its import bill in December soaring to an all-time high of $112-billion, the PBoC began draining liquidity, and clamped down on bank loans. Consequently, $12 /barrel of speculative fluff was wiped-off the crude oil market over the next two-weeks.
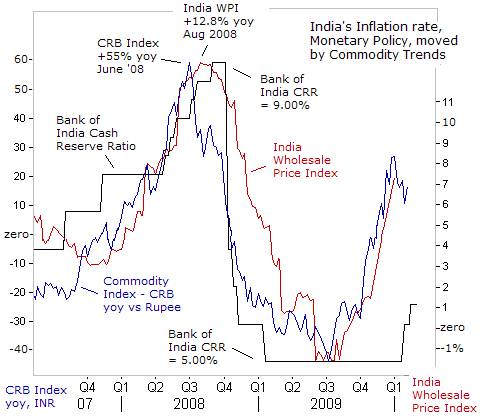
The Bank of India (RBI) followed suit on Jan 29th, surprising commodity traders, by lifting cash reserve requirements for banks by more than expected 75-basis points to 5.75%, and warned of mounting inflation, suggesting its next move may be an interest rate hike. India’s closely watched wholesale price index (WPI) is closely correlated with the direction of commodities, and the RBI has bumped-up its forecast for the WPI to an 8.5% inflation rate by year’s end.
On Feb 1st, India’s central bank chief Duvvuri Subbarao left no doubt about a tighter monetary policy in the months ahead. “It is the responsibility of the Reserve Bank to manage expectations about inflation and what we are going to do in the next few months is to target inflation,” he said. However, the resiliency of key commodities such as crude oil, buoyed by indications of expanding factory activity in the top industrialized nations, will make the task of containing inflation much harder for the PBoC and RBI. Therefore, traders can expect further Quantitative Tightening (QT) moves in Asian nations and hikes in interest rates in the months ahead.
“China might increase interest rates once consumer inflation exceeds the one-year benchmark deposit rate of 2.25%,” warned Ba Shusong, a prominent government adviser on Feb 1st. Consumer prices rose +1.9% in the year to December, but inflation could accelerate at a 6% clip, without further tightening measures. Thus, the Shanghai red-chip market is likely to remain under selling pressure, which in turn, is bound to cause greater anxiety in world commodity markets.
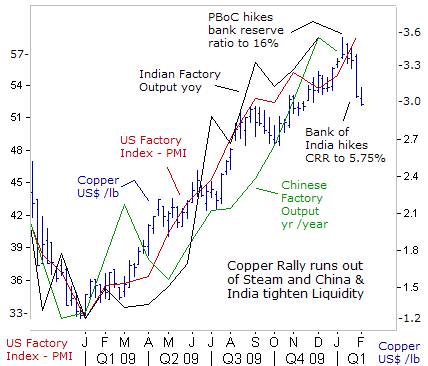 China consumed 43% of the world’s base metal supply last year. Thus, Beijing is most anxious to engineer a speculative shakeout in the base metals markets, to help lower the cost of key raw material imports. Copper was a star performer in the commodity sector last year, nearly tripling in value, from its lowest levels in December 2008, to as high as $3.55 /lb in January 2010, riding the boom of a powerful revival of global demand, including massive Chinese stockpiling.
However, in reaction to Chinese and Indian central bank tightening, combined with the Euro’s descent below $1.400 due to Greece’s debt crisis, copper futures in New York tumbled 20% from their January high, to around $2.87 /lb today. Global factory activity might begin to decelerate as Asian governments withdraw high powered fiscal and monetary stimulus, to prevent inflation from overheating.
Beijing is also aiming to weaken the leverage of the big-3 global miners, BHP Billiton, Brazilian mining giant Vale, and Rio Tinto, which control a combined 70% of the world’s sea-borne iron-ore market, ahead of critical contract negotiations. China imported a total of 630-million tons of iron ore in 2009, up 42% year-on-year, as it produced a record 700-million tons of steel. China’s iron ore import dependency ratio has increased from 44% in 2002 to 69% last year.
In the first round of iron ore pricing negotiations between Rio Tinto is asking Japanese and Korean steel mills for a 40% price increase. However, since Beijing tightened its monetary policy on Jan 12th, iron-ore prices have tumbled $10 /ton on the Chinese spot market to around $121 /ton today. Chinese steel mills might wait for iron ore prices to tumble further on the spot market, before agreeing to a 2010 contract price, especially if the PBoC plans to tighten its money supply further.
Gold weighed down by weaker Euro,
 Last year, China made great contributions to the world economy, as it was the first country to recover from the international financial crisis. As a result of its 4-trillion yuan stimulus spending, China’s debt to GDP ratio is expected to reach 31-percent this year, far less than the average government debt of OECD countries, which is projected to almost equal their total GDP this year, and exceed it in 2011.
In sharp contrast to the sound finances of China, backed by $2.4-trillion of foreign currency reserves, the newly elected government of Greece’s socialist Prime Minister George Papandreou faces massive pressure to get its fiscal house in order. Among the 16-nations within the Euro-zone struggling to cope with their budgetary imbalances, Greece faces the most difficult situation. With a budget deficit of 12.7% of GDP this year, and debt outstanding of €300-billion, Greece’s debt-to-GDP ratio is expected to top 120%. In the short term, Greece needs to borrow €53-billion before year’s end to refinance debt which is about to mature.
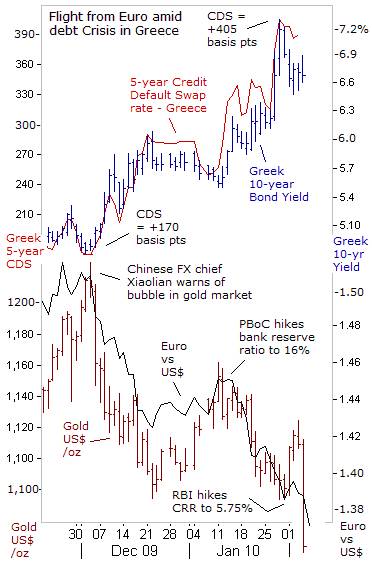
Over the course of the past two-months, the interest rate that Greece must pay in order to attract foreign capital for 10-years has risen by 175-basis points to 6.75% today. Amid growing doubts that Athens can repay its debt, the cost of insuring €10-million of Greek government bonds against default for five-years has soared to €370,000. That puts Greece among the top-four countries in the world that are most likely to default, behind Argentina, Ukraine, and Dubai.
On Jan 29th, Greek Prime Minister George Papandreou complained that his country was being targeted as a weak link, by speculators with ulterior motives, and seeking to profit handsomely from the possible break-up of the single European currency. Already, amid the capital flight from Greek bonds, there’s been a simultaneous exodus fleeing the Euro currency, knocking it below the psychological $1.400 area, from around $1.500 just two months ago.
In an ironic twist, the “flight for safety” from the Greek bond market, isn’t finding a “safe haven” in the gold market. Instead, the yellow metal is enduring selling pressure, undermined by the weakening Euro. The US-dollar is getting stronger by default, largely due to the unwinding of “carry trades” in global stock markets. Furthermore, spike rallies in the gold market could meet resistance, as it becomes increasingly apparent, that China and India are still on course for further tightening of their money supply (QT) in the months ahead. Also, G-20 central banks allowed their foreign currency swap agreements to expire as of Feb 1st, eliminating a huge source of global liquidity, which at its peak reached $586-billion.
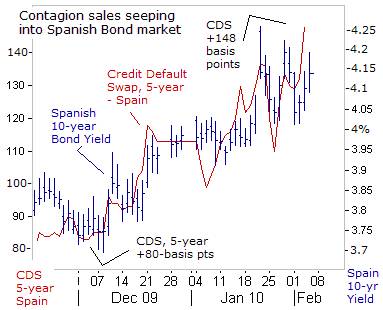 In the event that Greece defaults on its loans, or if its interest rates climb too high, it could prompt a chain reaction for other weak links in Euro-zone bond markets, with devastating consequences for the entire Euro currency system. The most vulnerable to capital flight is Spain, where the jobless rate hit 18.8% in the fourth quarter of 2009 and the government said it could reach 20% this year.
Already, contagion sales from the troubled Greek bond market are starting to seep into the Spanish bond market. The credit default swap rate to insure 10-million euros of Spanish bonds has nearly doubled to 148,000-euros, and yields have climbed 40-basis points higher to 4.15% over the past two months. Spain, expects a fiscal deficit of 9.8% of gross domestic product in 2010, but said its ratio of public debt to GDP should peak at 74% of GDP in 2012, well below Greek levels.
Still, capital flight from the weakest links in the Euro-zone bond markets is triggering the unwinding of US$ and Japanese yen carry trades, which in turn, is rattling global commodity and stock markets, and precious metals. While it’s true that the January Barometer was far off the mark in 2009, one also should remember that it’s been accurate for 90% of the time over the past 60-years. Much will depend on the degree to which the G-20 central banks drain the global liquidity swamp, which led that the emergence of asset bubbles in 2009.
This article is just the Tip of the Iceberg of what’s available in the Global Money Trends newsletter. Subscribe to the Global Money Trends newsletter, for insightful analysis and predictions of (1) top stock markets around the world, (2) Commodities such as crude oil, copper, gold, silver, and grains, (3) Foreign currencies (4) Libor interest rates and global bond markets (5) Central banker "Jawboning" and Intervention techniques that move markets.
By Gary Dorsch,
Editor, Global Money Trends newsletter
http://www.sirchartsalot.com
GMT filters important news and information into (1) bullet-point, easy to understand analysis, (2) featuring "Inter-Market Technical Analysis" that visually displays the dynamic inter-relationships between foreign currencies, commodities, interest rates and the stock markets from a dozen key countries around the world. Also included are (3) charts of key economic statistics of foreign countries that move markets.
Subscribers can also listen to bi-weekly Audio Broadcasts, with the latest news on global markets, and view our updated model portfolio 2008. To order a subscription to Global Money Trends, click on the hyperlink below, http://www.sirchartsalot.com/newsletters.php or call toll free to order, Sunday thru Thursday, 8 am to 9 pm EST, and on Friday 8 am to 5 pm, at 866-553-1007. Outside the call 561-367-1007.
Mr Dorsch worked on the trading floor of the Chicago Mercantile Exchange for nine years as the chief Financial Futures Analyst for three clearing firms, Oppenheimer Rouse Futures Inc, GH Miller and Company, and a commodity fund at the LNS Financial Group.
As a transactional broker for Charles Schwab's Global Investment Services department, Mr Dorsch handled thousands of customer trades in 45 stock exchanges around the world, including Australia, Canada, Japan, Hong Kong, the Euro zone, London, Toronto, South Africa, Mexico, and New Zealand, and Canadian oil trusts, ADR's and Exchange Traded Funds.
He wrote a weekly newsletter from 2000 thru September 2005 called, "Foreign Currency Trends" for Charles Schwab's Global Investment department, featuring inter-market technical analysis, to understand the dynamic inter-relationships between the foreign exchange, global bond and stock markets, and key industrial commodities.
Copyright © 2005-2010 SirChartsAlot, Inc. All rights reserved.
Disclaimer: SirChartsAlot.com's analysis and insights are based upon data gathered by it from various sources believed to be reliable, complete and accurate. However, no guarantee is made by SirChartsAlot.com as to the reliability, completeness and accuracy of the data so analyzed. SirChartsAlot.com is in the business of gathering information, analyzing it and disseminating the analysis for informational and educational purposes only. SirChartsAlot.com attempts to analyze trends, not make recommendations. All statements and expressions are the opinion of SirChartsAlot.com and are not meant to be investment advice or solicitation or recommendation to establish market positions. Our opinions are subject to change without notice. SirChartsAlot.com strongly advises readers to conduct thorough research relevant to decisions and verify facts from various independent sources.
Gary Dorsch Archive |
© 2005-2022 http://www.MarketOracle.co.uk - The Market Oracle is a FREE Daily Financial Markets Analysis & Forecasting online publication.


