Higher Highs coming in Gold!
Commodities / Gold and Silver 2010 Feb 02, 2010 - 09:42 AM GMTBy: Peter_Degraaf
 The recent peak in gold on December 2nd was interrupted by a pullback that most likely ended with a double bottom on Jan 28th. To help us determine if this pull-back is ready to give way to the next big rally we take a look at all of the pullbacks of 10% or more since the Gold Bull started its run in 2001. There have been 9 such pull-backs, including the one just ending.
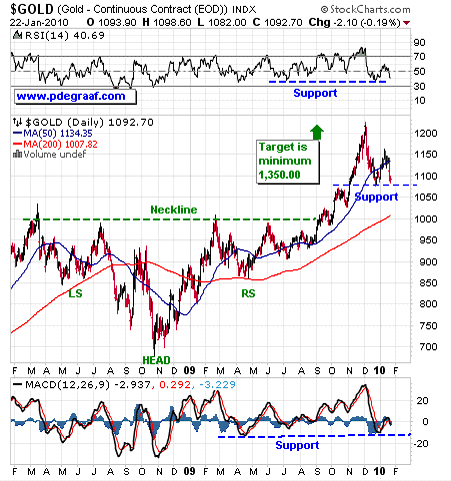
But first we draw your attention to a very bullish chart. It is the chart that highlights the inverted head and shoulders formation that came to life when gold broke out above the important $1,000.00 level. This breakout portends a target of $1,350.00 minimum, and some would conclude at target at $1,500.00
Next we will examine the various pullbacks of 10% or more that have occurred since the beginning of the gold bull market.
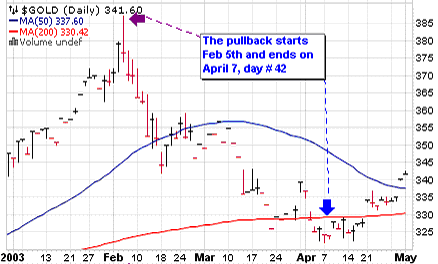
The first chart covers the rise to a top on February 5th 2003 that reached 19% above the 200DMA. The subsequent pullback lasted 42 days.
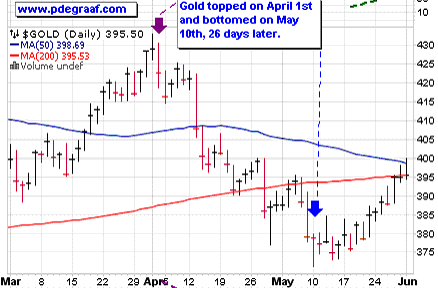
The second chart covers a top on April 1st 2004 14% above the 200DMA. The subsequent pullback ended 26 days later on May 10th.
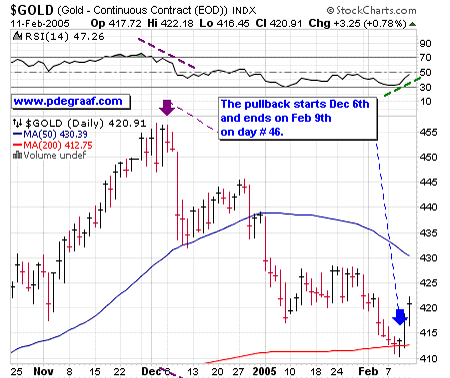
Chart number three covers the gold price as it produced a top in late 2004 at 13% above the 200DMA. The pullback that started on Dec 6th lasted 46 days.
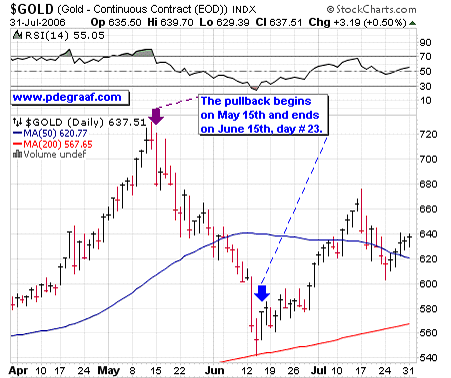
Number four is the rally in gold that peaked May 14th/2006, 35% above the 200DMA.
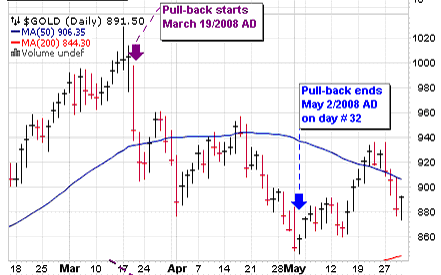
Number five is the gold chart from early 2008. Price had just experienced a nice run-up, and as often happens in March, price began a pull-back, after reaching a peak 22% above the 200DMA. This pull-back began on March 19th and ended 32 trading days later on May 2nd.
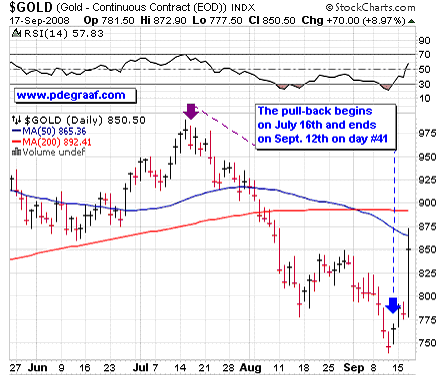
Number six is the gold price peak on July 15th, 11% above the 200DMA. Price began to correct the next day and turned back up on Sept 12th, 41 days later.
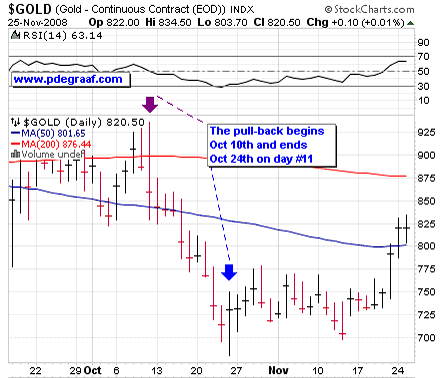
Number seven is the top in gold that was produced on Oct 10th, a premature top, due to the credit crisis which brought everything down. The subsequent correction ended on Oct 24th on day #11.
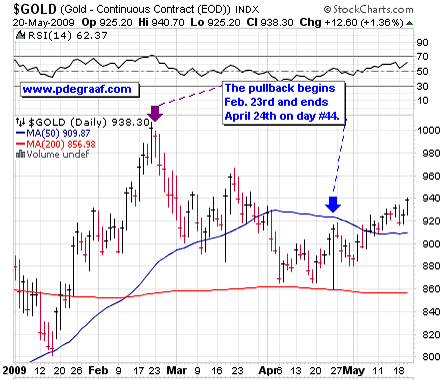
Number eight is the gold peak of Feb 20th 2009 at 20% above the 200DMA. Price corrected then and the correction ended 44 days later on April 24th.
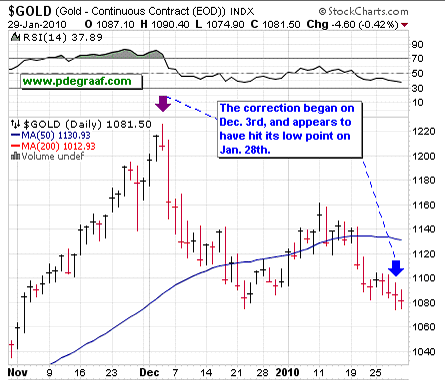
On the assumption that gold’s action on February 1st confirmed the latest cycle bottom, 38 days from the Dec. 2nd top, then the average of the last nine gold bottoms is 34 days, indicating that the time for a turnaround was at hand.
In this last chart we throw some water on the theory that the HUI index always trends in the opposite direction to the US dollar. Shown at the bottom of this chart is the US dollar for comparison. During most of 2005, the HUI and the US dollar marched in lock-step.
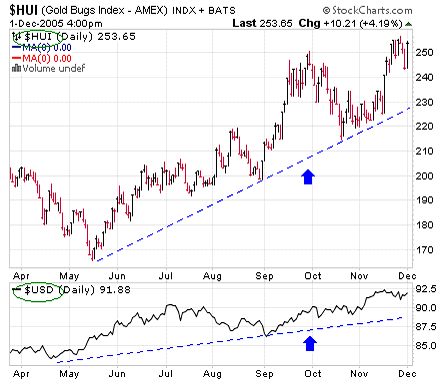
The chart at the top is the HUI Index of gold and silver stocks and the chart at the bottom is the US dollar. The period covered is from April to December 2005.
Because of very bullish fundamentals (more and more money chasing less and less gold), and because of the length of this pullback in terms of the number of days (38), and because the bears can only control price for so long, we are much closer to a bottom (think inches), than we are to a top (think miles). Those of you who like to trade gold and silver stocks might like to visit the website and click on a popular feature: ‘Stock Pick of the Week’.
DISCLAIMER:
Please do your own due diligence. Investing involves taking risks. I am NOT responsible for your trading decisions.
Happy trading!
By Peter Degraaf
Peter Degraaf is an on-line stock trader with over 50 years of investing experience. He issues a weekend report on the markets for his many subscribers. For a sample issue send him an E-mail at itiswell@cogeco.net , or visit his website at www.pdegraaf.com where you will find many long-term charts, as well as an interesting collection of Worthwhile Quotes that make for fascinating reading.
© 2010 Copyright Peter Degraaf - All Rights Reserved
DISCLAIMER: Please do your own due diligence. I am NOT responsible for your trading decisions.
Peter Degraaf Archive |
© 2005-2022 http://www.MarketOracle.co.uk - The Market Oracle is a FREE Daily Financial Markets Analysis & Forecasting online publication.


