


Gold and Silver Melting Down or Bottoming
Commodities / Gold and Silver 2010 Jan 31, 2010 - 03:37 PM GMTBy: Chris_Vermeulen

 The past two months have been tough on the precious metals sector. We saw precious metals lead the market higher all of last year until December 2009 when prices plummeted as the US Dollar started to bounce. The continued rise in stocks indicated an extreme overbought condition and alerted us that a sharp pullback was going to take place.
Many traders including myself were surprised that the broad market did not sell down with the metals. In December the market looked and felt ready for a sharp pullback but new money continued to flow into stocks, pushing the market higher. This slow and steady grind higher was very frustrating to watch because the market was making new highs day after day while obviously needing to take a breather at any time.
It’s this grind higher that sucks in the last retail buyers before prices collapse, unfortunately leaving many holding overpriced securities and commodities for sale another day.
Since gold lead the market up last year it should be the first to correct and also pullback quicker and deeper than its followers (stock market). This is what we are seeing now which I explain below using charts.
HUI – Gold Stock Index – Monthly Gold Trading Chart
I use this exact month chart for helping to time long term trends for gold and gold stocks. It looks as though we have temporarily formed a double top with this current breakdown. It will most likely take several months to repair the damage done to this chart and possibly more than a year.
There are two options for this chart:
1 - It will form a bullish flag or pennant then continue its move higher.
2 - Or will continue to slide, indicating sellers are in control and that we are looking at a multi year trading range as the market digests the 10 year rally in gold.
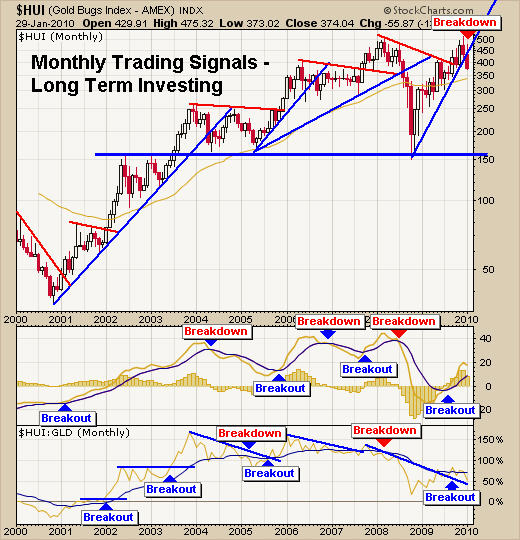
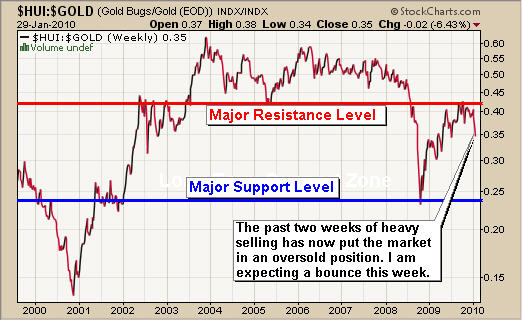
The HUI:GOLD Ratio – Weekly Gold Trading Chart
This chart goes up if gold stocks are out performing the price of gold and down if they are underperforming. From 2001 – 2006 the chart looked very bullish but as time went on the ratio really started to look weaker and weaker.
The 2008 meltdown crushed precious metal stocks and the recent rally back up to resistance looks very bearish. It looks like a large bear market rally (test of breakdown level). This also goes for the monthly chart above. I cannot say either chart is looking bullish anymore. Things really depend on how strong the next bounce/rally is so we can gauge the strength behind the move (dead cat bounce, or legitimate rally).
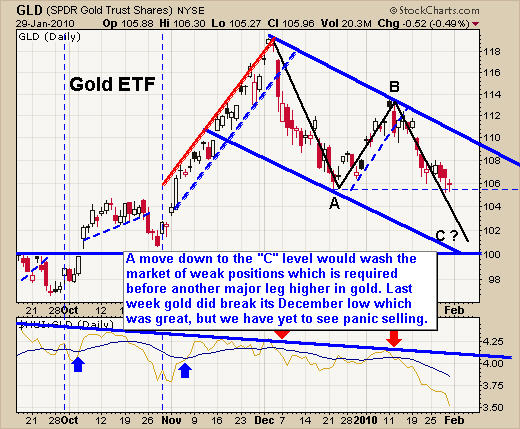
Gold GLD ETF – Daily GLD Trading Chart
The next three charts really pull things together in my opinion in terms of how much selling is left in the market on the daily chart time frame.
Here I have drawn on a daily chart showing what I figure will unfold over time. This is the same pattern that I have been talking about since early December. I love trading ABC retrace patterns because of their accuracy and follow through on trend reversals.
In short, if we see gold break this support level then traders are going to panic out of the market sending the GLD fund towards the $101-$103 level. This panic selling is exactly what is needed if we want to see gold continue a sustainable and strong bull market rally higher.
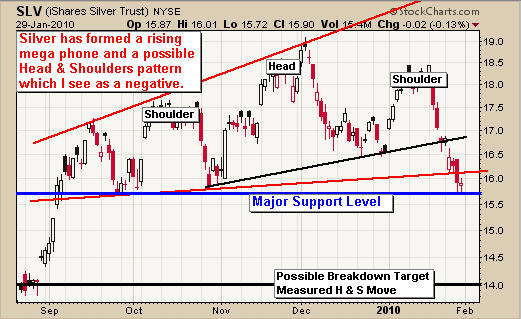
Silver SLV ETF – Silver Trading Chart
Silver has been a little more difficult to trade as the chart clearly shows the choppy price action. I feel that if silver breaks this level of support we should expect to see $14-$14.50 quickly.
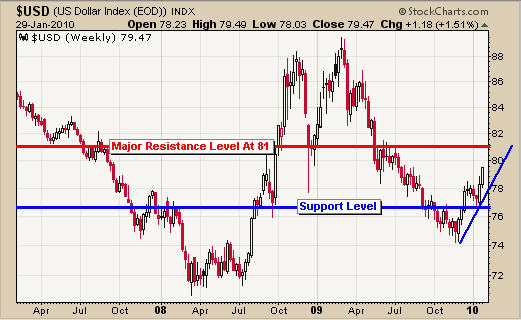
US Dollar Trading – Daily Dollar Trading Chart
This chart pulls the above GLD and SLV charts together. Both gold and silver have more room to fall before reaching a major support level. Knowing that and looking at this chart of the Dollar you can see the Dollar has approximately the same amount of room to rally.
So in a perfect trading scenario, the dollar will continue to climb for a few more days to reach resistance and in return that will push gold and silver down for a few more days.
Precious Metals Trading Conclusion:
I think this week will be a pivotal one. I can see the dollar moving higher sending precious metals and stocks down enough to shake traders out of their long positions in gold, silver and stocks. Once the sentiment turns bearish we will begin looking for an oversold speculative trade and possibly a low risk trend trade setup.
As for the energy sector, both crude oil and natural gas look weak and I continue to patiently await a low risk setup for each.
Get my Free Weekly ETF Trading Reports at www.GoldAndOilGuy.com
Hello, I'm Chris Vermeulen founder of TheGoldAndOilGuy and NOW is YOUR Opportunity to start trading GOLD, SILVER & OIL for BIG PROFITS. Let me help you get started.
To Your Financial Success,
By Chris Vermeulen
Chris@TheGoldAndOilGuy.com
Please visit my website for more information. http://www.TheGoldAndOilGuy.com
Chris Vermeulen is Founder of the popular trading site TheGoldAndOilGuy.com. There he shares his highly successful, low-risk trading method. For 6 years Chris has been a leader in teaching others to skillfully trade in gold, oil, and silver in both bull and bear markets. Subscribers to his service depend on Chris' uniquely consistent investment opportunities that carry exceptionally low risk and high return.
This article is intended solely for information purposes. The opinions are those of the author only. Please conduct further research and consult your financial advisor before making any investment/trading decision. No responsibility can be accepted for losses that may result as a consequence of trading on the basis of this analysis.
Chris Vermeulen Archive |
© 2005-2022 http://www.MarketOracle.co.uk - The Market Oracle is a FREE Daily Financial Markets Analysis & Forecasting online publication.