


Stock Market Dumb Money Still Bullish Despite 7% Sell Off
Stock-Markets / Stock Markets 2010 Jan 31, 2010 - 02:49 PM GMTBy: Guy_Lerner

 From the highs three weeks ago to the lows of this past week, the S&P500 has slid about 7%. This is not as great as the mid- June to mid- July, 2009 swoon, which saw the S&P500 loose about 10%. So maybe investors are right in not being too concerned about the pace of the current downdraft, and when looking at the sentiment indicators this week, that is exactly what we see: complacency amongst the "dumb money" and indifference by the "smart money". Despite any short term gains over the next week, this still is not a high reward, low risk investing environment.
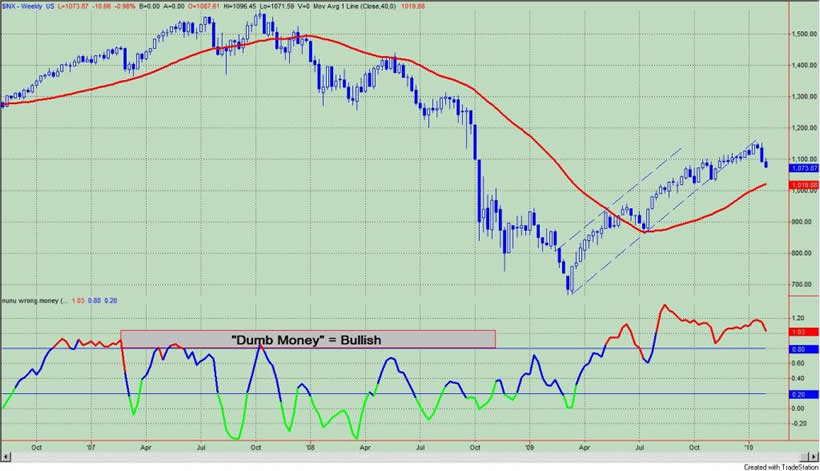
The "Dumb Money" indicator, which is shown in figure 1, looks for extremes in the data from 4 different groups of investors who historically have been wrong on the market: 1) Investor Intelligence; 2) Market Vane; 3) American Association of Individual Investors; and 4) the put call ratio. The "Dumb Money" indicator shows that investors remain extremely bullish.
Figure 1. "Dumb Money" Indicator/ weekly
The "Smart Money" indicator is shown in figure 2. The "smart money" indicator is a composite of the following data: 1) public to specialist short ratio; 2) specialist short to total short ratio; 3) SP100 option traders. The Smart Money indicator is neutral to bearish.
Figure 2. "Smart Money" Indicator/ weekly
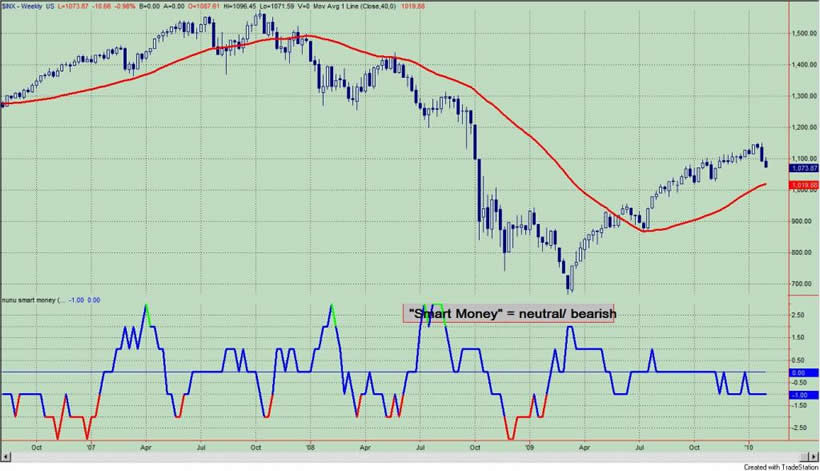
Figure 3 is a weekly chart of the S&P500 with the InsiderScore "entire market" value in the lower panel. Due to the start of earnings season, insider trading volumes remain light.
Figure 3. InsiderScore Entire Market/ weekly
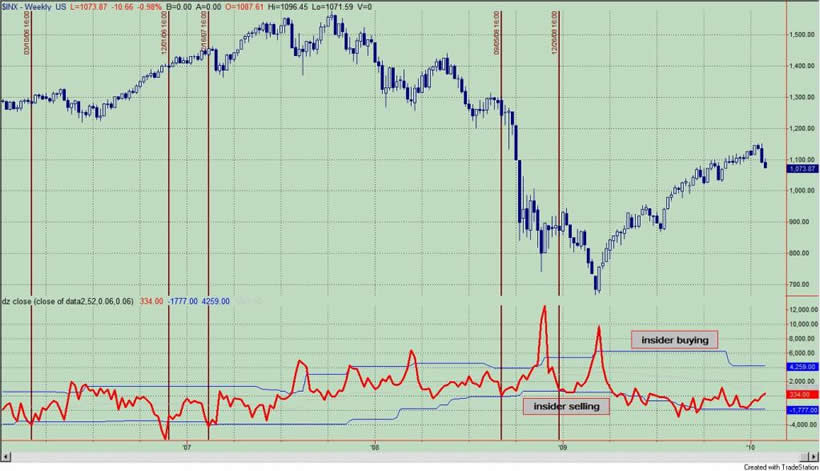
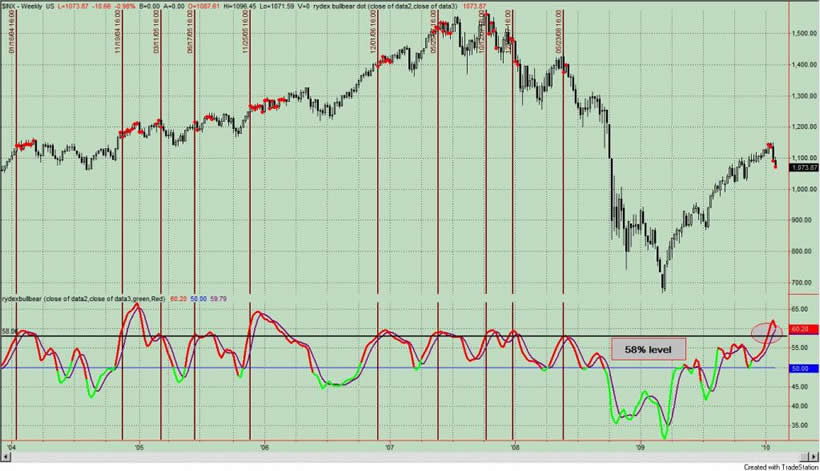
Figure 4 is a weekly chart of the S&P500. The indicator in the lower panel measures all the assets in the Rydex bullish oriented equity funds divided by the sum of assets in the bullish oriented equity funds plus the assets in the bearish oriented equity funds. When the indicator is green, the value is low and there is fear in the market; this is where market bottoms are forged. When the indicator is red, there is complacency in the market. There are too many bulls and this is when market advances stall.
Currently, the indicator is red and the value exceeds 58%. In other words, greater than 58% of the assets are in bullish funds (leveraged and non leveraged) relative to all of the equity funds. There is nothing magical about the number 58%, but intermediate term swings in the past 10 years have been identified when this indicator exceeded the 58% mark. These extremes in the indicator are noted by the red dots on the price chart and the maroon colored vertical lines.
Figure 4. Rydex Total Bull v. Total Bear/ daily
Lastly, I must admit that I am surprised by the sentiment picture this week. I thought the indicators would reflect a less bullish posture amongst investors. The pace and breadth of this sell off seems different than any that have occurred through out this rally. And let's remember this: 1) the sell off is coming on the heals of a 70% plus gain in the S&P500; 2) many leading sectors and ETF's have broken down --emerging markets, China, and metals come to mind; 3) safe havens, like the Dollar and maybe Treasury bonds, seem to be attracting investors; 4) good news, like strong earnings and positive GDP, is being met by selling. It is hard to believe that investors can remain this complacent, but the data tells a different story.
The sentiment indicators still suggest that better buying opportunities lie ahead, and the best way to see investors turn from bullish to bearish (i.e., bull signal) is to have lower prices over the next weeks and months.
By Guy Lerner
http://thetechnicaltakedotcom.blogspot.com/
Guy M. Lerner, MD is the founder of ARL Advisers, LLC and managing partner of ARL Investment Partners, L.P. Dr. Lerner utilizes a research driven approach to determine those factors which lead to sustainable moves in the markets. He has developed many proprietary tools and trading models in his quest to outperform. Over the past four years, Lerner has shared his innovative approach with the readers of RealMoney.com and TheStreet.com as a featured columnist. He has been a regular guest on the Money Man Radio Show, DEX-TV, routinely published in the some of the most widely-read financial publications and has been a marquee speaker at financial seminars around the world.
© 2010 Copyright Guy Lerner - All Rights Reserved
Disclaimer: The above is a matter of opinion provided for general information purposes only and is not intended as investment advice. Information and analysis above are derived from sources and utilising methods believed to be reliable, but we cannot accept responsibility for any losses you may incur as a result of this analysis. Individuals should consult with their personal financial advisors.
Guy Lerner Archive |
© 2005-2022 http://www.MarketOracle.co.uk - The Market Oracle is a FREE Daily Financial Markets Analysis & Forecasting online publication.