Gold the Only Best Bull Market in Town
Commodities / Gold and Silver 2010 Jan 31, 2010 - 02:56 AM GMT Gold is trying to carve out a bottom, as it fell 11.20 for the week, closing at $1081.50 (-1.02%). Downside momentum has lessened from last week’s 3% decline.
The big question now is: where is gold going to from here? No one knows for sure, but let’s take a look at where it is, and where it has come from, in order to determine the most probable scenario going forward.
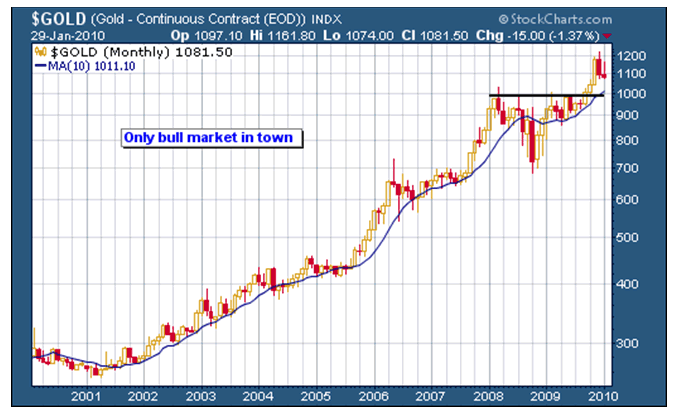
The following chart gives a long term perspective on gold – covering the start of its bull market until the present. It is a monthly chart that rises from the lower left to the upper right: a bullish signature.
The chart confirms that gold is in a long term bull, making recent all-time highs in December, from which it has corrected about 12%. For a different perspective on this decline, let’s look at some past price action.
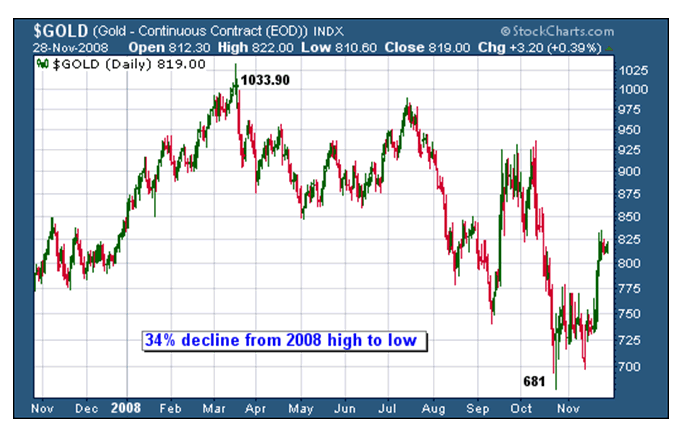
Up next is a chart that goes back to the beginning of 2008, when gold made a new high at $1033.90; and its subsequent decline into the Oct. low of $681.00. This was a 34% correction.
From the $681 low, gold then rose to $1226 – for an 80% gain. Presently, gold has corrected about 12% off its all-time high.
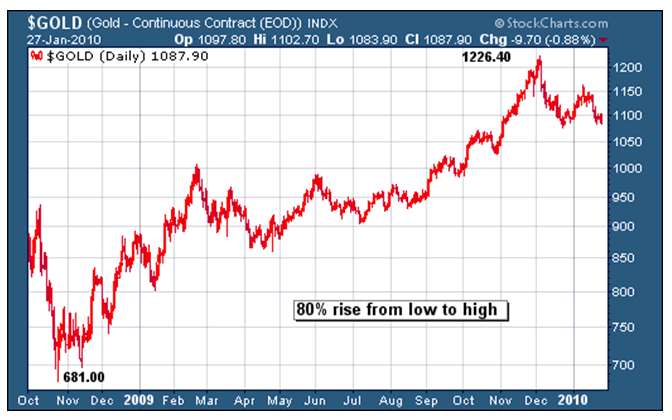
Needless to say, gold has performed better than any other asset during the last decade, especially in regards to maintaining purchasing power (value or wealth). Gold has made large moves in both directions, but the trend is from the lower left to the upper right of the chart – a bullish trend: higher highs and higher lows, ascending in stair-step fashion.
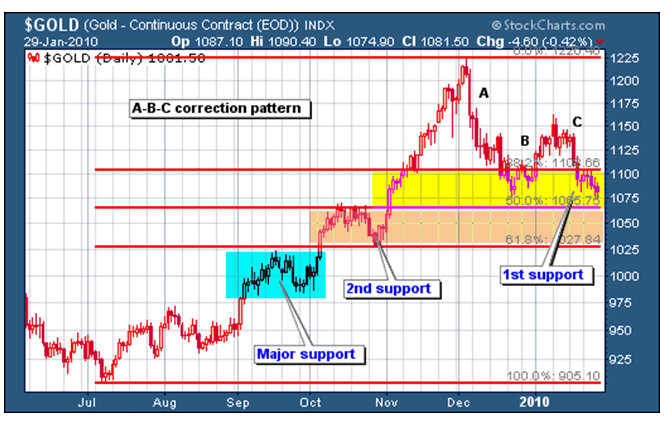
The chart below shows gold’s price action from the July low, up to the December high, and the subsequent decline, which appears to be forming an A-B-C corrective pattern. Price is presently testing its 50% fib retracement level. Further below is the 62% area (1027), and major support lies at $975-$1025.
Since April we have discussed the possible inverse head & shoulders pattern that was forming, which projected upside potential to $1300 – if the formation broke out and was confirmed.
The next chart shows that in Sept. - Oct. gold broke out and advanced to $1226, not far from the projected high. Many investors are disappointed that the $1300 price was not reached. Some analysts view gold as being weak because it did not advance to the $1300 target.
Be that as it may, it is what gold does from here that will determine if it is strong or weak – not whether some theoretical upside target was reached or not. There are many ways to skin a cat; and gold has numerous ways it can continue to sustain its bull market.
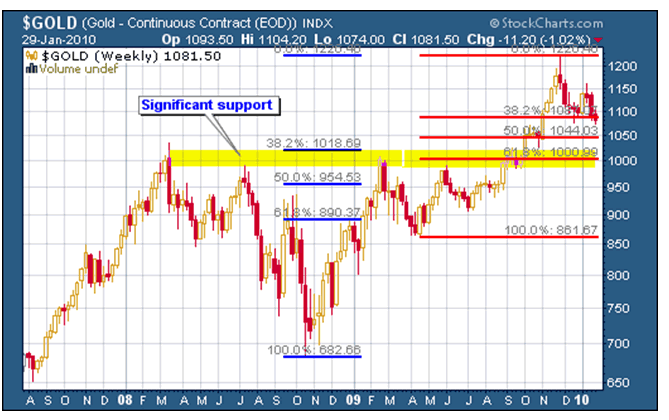
On the chart below are two sets of Fibonacci retracement numbers. The blue set rises from the Oct. 2008 lows and extends up to the recent high at 1226. Notice that the 38.2% Fib level is at $1018.19.
The red set of Fibs extends up from the April low, to the all-time high at 1226.00. Price is presently testing the 38.2% Fib level of this series, with hints it may test the 50% level.
Of particular interest, however, is the yellow band that indicates where the blue 38% Fib level overlaps with the 62% red Fib level: the area around $1020 - $980.
When two different Fib levels intersect like this, it can mean that the overlap marks a significant support level. Since the inverted head & shoulders formation broke out, and the subsequent correction ensued, I have maintained that it would be of no surprise if gold corrected back to the $1000.00 level.
This does not mean it will. The charts simply show that it is possible and would be no big deal, as long as the support area ($950-$1050) holds. Gold will simply move from weak to strong hands.
Gold Stocks
Gold stocks, as represented by the GDX index, got whacked once again this past week. Fortunately, to regular readers, this was no surprise. I have warned that if the stock market turned down, as expected, while at the same time gold continued to correct, as suggested; that it would be bloody hell for the pm stocks, and unfortunately it has been. We may, however, be closer to the end than the beginning, which is good news.
For the week, the GDX declined over 7% and is down 26% from its recent highs made in November, just three months ago. This is a decline that one would be better off not sitting through. The train that supposedly leaves everyone standing behind at the station has not yet done so since the gold bull began. Markets go up and markets go down – that’s what they do. It is best to stand aside when they go down 26%.
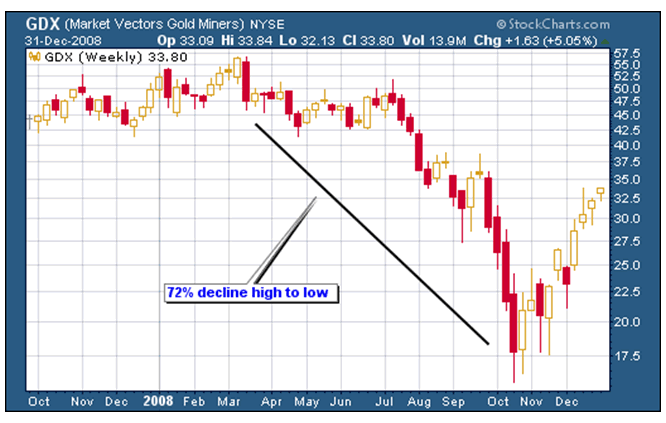
Let’s take a look at what the GDX (pm stocks) has done in the last year or so, to get a better perspective on what might happen going forward. The next chart shows the GDX falling 72% from its 2008 high – an abysmal fall into the Oct. to Nov. lows.
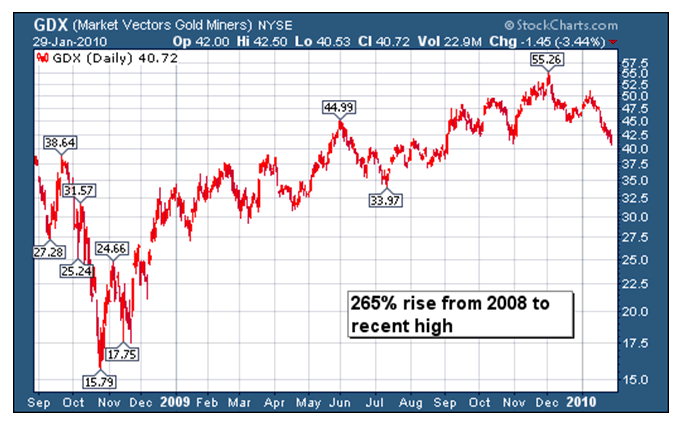
The second chart shows the GDX rising 265% from its 2008 low to its recent high, which just fell short of its 2008 high. This is a perfect example of why one wants to step aside of serious declines: even a tripling of price from such lows, only gets one back to “even”.
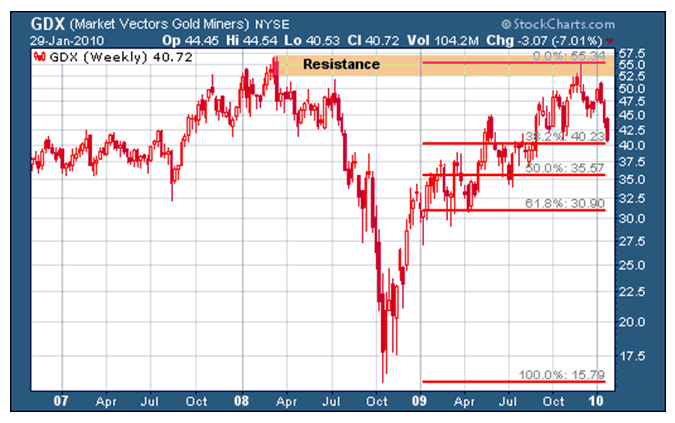
Now, after rising 265% in about a year’s time, the GDX has corrected 26%. As the third chart below shows, price has retraced to its first Fib level (38%) coming out of the 2008 low.
Last week’s report stated:
Price has dropped well out of it rising price channel and below lower horizontal support at 44, suggesting the Nov. low may come under fire. The first Fib level (38%) comes in around 40. If an intermediate term correction is unfolding, this is the likely target.
As the chart shows – the GDX closed the week out at 40.72 and it’s still possible more downside action is waiting. A lot depends on what the stock market does from here.
If the overall market goes down, it will put a headwind to the pm stocks; especially if gold corrects further, which brings the dollar’s direction into the picture. A follow through of the dollar’s rally will be hard on stocks, commodities, and gold and silver.
The above excerpt is from this week’s full market wrap report available at the Honest Money Gold & Silver Report website. All markets are covered: stocks, bonds, currencies, and commodities, with special emphasis on gold and silver. Stop by and check it out. A free trial subscription is available by visiting the site or emailing: dvg6@comcast.net.
Good luck. Good trading. Good health, and that’s a wrap.

Come visit our website: Honest Money Gold & Silver Report
New Audio-Book Now Available - Honest Money
Douglas V. Gnazzo
Honest Money Gold & Silver Report
About the author: Douglas V. Gnazzo writes for numerous websites and his work appears both here and abroad. Mr. Gnazzo is a listed scholar for the Foundation for the Advancement of Monetary Education (FAME).
Disclaimer: The contents of this article represent the opinions of Douglas V. Gnazzo. Nothing contained herein is intended as investment advice or recommendations for specific investment decisions, and you should not rely on it as such. Douglas V. Gnazzo is not a registered investment advisor. Information and analysis above are derived from sources and using methods believed to be reliable, but Douglas. V. Gnazzo cannot accept responsibility for any trading losses you may incur as a result of your reliance on this analysis and will not be held liable for the consequence of reliance upon any opinion or statement contained herein or any omission. Individuals should consult with their broker and personal financial advisors before engaging in any trading activities. Do your own due diligence regarding personal investment decisions. This article may contain information that is confidential and/or protected by law. The purpose of this article is intended to be used as an educational discussion of the issues involved. Douglas V. Gnazzo is not a lawyer or a legal scholar. Information and analysis derived from the quoted sources are believed to be reliable and are offered in good faith. Only a highly trained and certified and registered legal professional should be regarded as an authority on the issues involved; and all those seeking such an authoritative opinion should do their own due diligence and seek out the advice of a legal professional. Lastly Douglas V. Gnazzo believes that The United States of America is the greatest country on Earth, but that it can yet become greater. This article is written to help facilitate that greater becoming. God Bless America.
© 2005-2022 http://www.MarketOracle.co.uk - The Market Oracle is a FREE Daily Financial Markets Analysis & Forecasting online publication.


