Keeping Your Options Open (and Valuing Them)
InvestorEducation / Options & Warrants Jan 28, 2010 - 08:30 AM GMTBy: Andy_Sutton
 It is often said that there is nothing new under the sun. Truly, economic events of late have demonstrated this in spades. There is little that is new, just different flavors of the same. So, in the absence of anything substantially new to add to the collection of events this week, I am going to take an opportunity to return to some of the analytical topics that I’ve had but a few precious chances to deal with over the past three and a half years. The last foray dealt with some hedging strategies involving options and inverse funds. This week I’m going to dig deeper into the options side of hedging and look at some of the various pricing models available for consideration. Then we’ll take the models for a spin and create ourselves a hypothetical situation and see how things play out.
As previously discussed, options can be used to hedge portfolios against moves that are contrary to that portfolio’s orientation. For example, buying put options can be used to hedge a portfolio that is on the long side of the trade. Oppositely, buying calls can be used to hedge a portfolio that is primarily focused on the short side.
The difficulty in assessing options is figuring their value at a given point in time since they lose part of their extrinsic value as their witching (expiration) day approaches. Fortunately, there are a couple different models we can use to make quantitative predictions.
Binomial Option Pricing Model
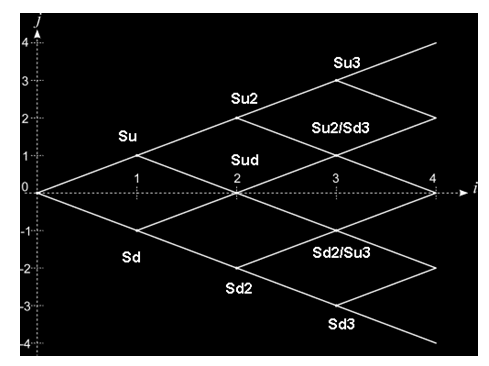
The Cox, Ross, and Rubenstein Binomial Model is probably the simplest of the mainstream models available, and is flexible in that it works both on options that can be exercised over a period of time such as American options, but also on options with specific exercise dates such as Bermudan options. The model is built on the simple assumption that a stock can move in one of two directions in a given time period. The price can move up Su with a probability of p or it can move down Sd with a probability of (1-p). The figure below shows 3 generations of such binomial possibilities at each stage. Once the binomial lattice is constructed, the probabilities at each time point can be calculated at various standard deviations from the mean. When pricing options, it must be considered that you’re really dealing with several axes; the first being the price of the underlying asset as it compares with the option’s strike price and the second being the time factor. Let’s look at some other models, and then run a few live examples.

Black-Sholes Option Pricing Model
The Black-Sholes Model applies to equities whose price follows Geometric Brownian Motion or a stochastic price process. For simplicity’s sake, the prerequisite for using the model is price action characteristics that are often observed in financial instruments such as equities.
There are several assumptions that the Black-Sholes model makes, some of which are not able to be met in the real-world investment environment, but similarly to the notion of the perfect competition / pure monopoly continuum, such constructs can be valuable despite the fact that they are seldom achievable in their purest forms.
- Borrowing can happen at will at a constant and known risk-free rate.
- The price follows a Geometric Brownian motion with constant drift and volatility. (This is extremely rare in our markets)
- Transaction costs are set to zero.
- There are no dividend payments to navigate. (Dividend harvesting strategies often upset predictable Brownian motion)
- All securities are perfectly divisible. (Fractional shares such as in a DRIP type setting are available)
- There are no restrictions on short selling.
- There is no opportunity for arbitrage.
There are several variations of the Black-Scholes model; one that deals strictly with the price of the equity security, and a partial differential equation (PDE) that deals with derivatives of an underlying equity. While the formula is shown only for reference purposes, the general idea is to understand that one can use this modeling process to estimate the value of the derivative security (in this case an option) at a specific known point in time.

Bjerksund-Stensland Model
This model comes in handy if you happen to be dealing with options whose underlying securities pay dividends. It is a hybrid of the Black Model, the Black-Scholes Model, and the Garman-Kohlhagen Model. However, there are still some assumptions that are not realistic. The model depends on constant dividend yields, discrete dividends, and continuous dividends. While there is a negligible amount of securities (if any) that fit these assumptions entirely, the model has through repeated study shown itself to be more accurate than the Quadratic Approximation Formula in nailing the value of long-dated options.
I mention this model due to its applicability to dividend paying stocks and its affinity to long options for those interested in using it for analysis of LEAPS options.
Exercises
For the purposes of this piece we’re going to run two simulations; one with the Diamonds as our core investment and a single protective put option and the second (also with the Diamonds) using what is known as a Butterfly, which actually involves buying two options and selling a third. We’ll see how the various strategies predict gains at different price levels a year from now according to the three aforementioned models.
Let’s list our assumptions for the first exercise:
-We’re going to buy 1000 shares of DIA
-We’ll buy 25 puts on DIA, which expire on 12/21/2012 with a strike price of $90.
-We will setup our price point analysis as follows:
$140.00 (assumes the Dow makes a new high – bullish case)
+10%, live, -10% of today’s price
$65.00 (assumes a retest of 3/6/2009 lows – bearish case)
-Interest will be set to the “risk-free” (sic) rate of 4.56%, which equals 30-year Treasury Bond yields on 1/27/2010.
-We assume the trades are made today at market prices and we’re looking at P/L one the trades one year from today.
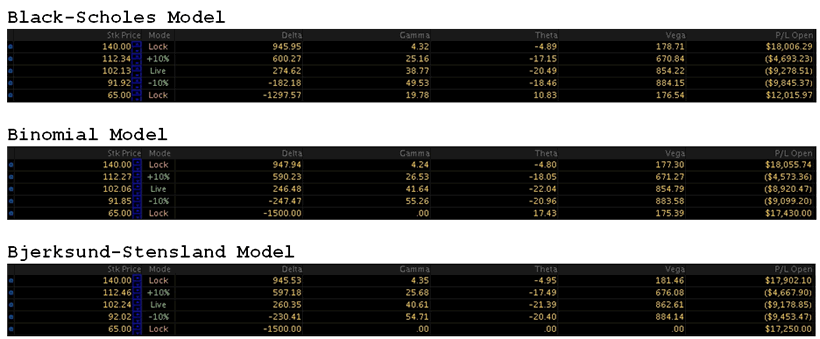
Here are the results:

What all three of these models are telling us is that the best way to make money with this setup is if the Dow moves big in one direction or the other. If the Dow maintains the status quo and stays within 10% over the next year, this allocation will lose money. The tools are predictive, but the user has to provide the assumptions. If you have a strong belief that the market is going to go down and retest those March 2009 lows, then you can use these models to build yourself a hedging program and then predict the results of such a program. You can tweak the variables, interest rates, etc as well. You can even add additional positions and see how the scenarios play out. This is one of the techniques that we’ve used over the past few years to mitigate periods of market downturn in our newsletter’s portfolio model.
Changing the Strategy
Obviously the first exercise provided a significant amount of risk and depended greatly on us being right in our prediction. If we’re wrong, we could lose a significant amount of money. Clearly there has to be a better middle ground; and there is.
Let’s change up the variables a bit and see if we can’t get something a little more balanced. For this comparison, we’ll use what is known as a Butterfly. Essentially what a Butterfly does in our case is purchases 1000 shares, buys 10 puts at $100 strike price, buys 10 more puts at $80 strike price and sells 10 puts at $90.
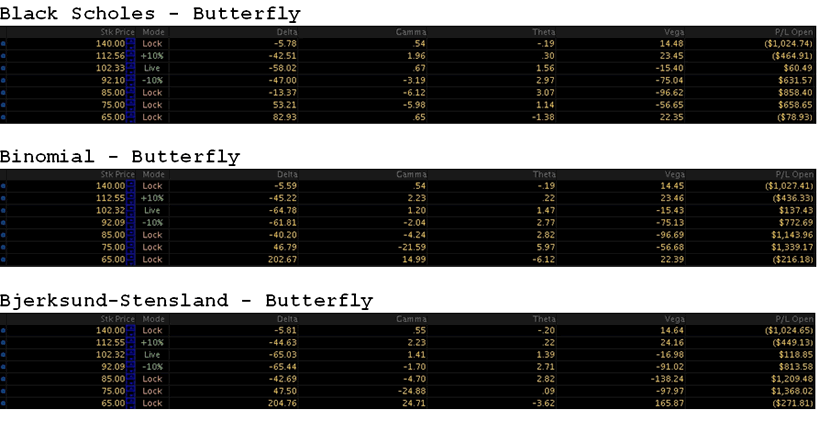
Let’s look at the results; again. We have added some price levels between the $65 and the $92 range to give a better illustration, however, all computational variables are the same as before.

Obviously the butterfly strategy worked very well in terms of smoothing the returns across a wide variety of prices. Keep in mind in both cases we were working with around a $100,000 corpus of capital and limiting the action to 1% is especially beneficial if that capital happens to yield more than the Diamonds and you’re collecting significant dividend income.
So, depending on your intentions and purposes, you can either use your option strategy to make a bet on the overall direction of the market and try to make a profit off of it or use an option strategy that allows you to collect dividends without worrying so much about a major market downturn diminishing the value of the underlying assets.
Some Potential Pitfalls
If you decide to investigate any of these types of strategies, you are going to want to keep your eye on a few things:
1) Does the derivative security appropriately represent what it is you’re trying to protect? For example, in our newsletter’s model portfolio, we have 21 dividend producing assets. Obviously, creating a butterfly strategy might be to our advantage. Not all of our components are equities, and many don’t have option chains so we’ll need to find something that does. But what options should we use? Using the Diamonds puts discussed above might work IF the relationship between my portfolio and the Diamonds is somewhat analogous. If it isn’t, then I might not end up where I should be even if the models happen to be spot on. The importance of this issue cannot be emphasized enough.
2) Use options that come from well defined option chains and are not thinly traded whenever possible. If you are working with an option that has just a few hundred contracts of open interest and low volume, authentic price discovery can be a problem because of wide bid/ask spreads. This is not to say it is impossible if the options are thinly traded, but it makes life more complicated.
3) The options pricing models are not always correct; especially in times of acute distress in the markets since the normal Brownian, stochastic oscillations of securities are disturbed and therefore, a portion of the predictive value of the models is lost.
Conclusions
It must first be pointed out that you don’t need fancy trading platforms or expensive financial software to use these models. While it is exceedingly complicated to do the calculations manually, there are websites on the Internet where you can download Excel Macros and add-ins that will allow you to enter the parameters and the custom software will do the rest. Go to your favorite search engine and key in the name of the model you’re interested in and you’ll quickly find a plethora of potential solutions.
We have presented two approaches to hedging, both with options and with drastically different results. For our purposes here at the firm, the Butterfly strategy obviously makes a lot of sense since a growing portion of our work centers around income investing. Being able to mark time with capital while raking in stellar dividend income is obviously something every fixed income investor would like to be able to do. In this era of near-zero interest rates, which just got stretched out by at least another month by the Fed today, it is not always an option to bail out of a sick market, especially when the income is needed to finance someone’s standard of living.
By Andy Sutton
http://www.my2centsonline.com
Andy Sutton holds a MBA with Honors in Economics from Moravian College and is a member of Omicron Delta Epsilon International Honor Society in Economics. His firm, Sutton & Associates, LLC currently provides financial planning services to a growing book of clients using a conservative approach aimed at accumulating high quality, income producing assets while providing protection against a falling dollar. For more information visit www.suttonfinance.net
Andy Sutton Archive |
© 2005-2022 http://www.MarketOracle.co.uk - The Market Oracle is a FREE Daily Financial Markets Analysis & Forecasting online publication.


